 User Guide — Interactive Growth Charts
With the Interactive Growth Charts feature, you can adjust your view of pediatric growth charts for display and printing, to suit the needs of your patients and their parents.
To use the Interactive Growth Charts tool, your practice must use athenaClinicals and you must request that the Interactive Growth Charts feature be enabled for your practice (please contact the CSC from athenaOne > Support > Success Community > Contact Client Support Center.
You can access the interactive growth charts using the Chrome, Safari, and Microsoft Edge browsers only.
The Interactive Growth Charts tool does not support the Height Velocity or Weight by Stature charts. If you use these charts, continue to use the existing growth charts.
Printing a chart using the Chart Export tool produces the standard athenaOne growth charts.
The interactive growth chart has graphs for length/stature, weight, BMI, head circumference, and percentiles.
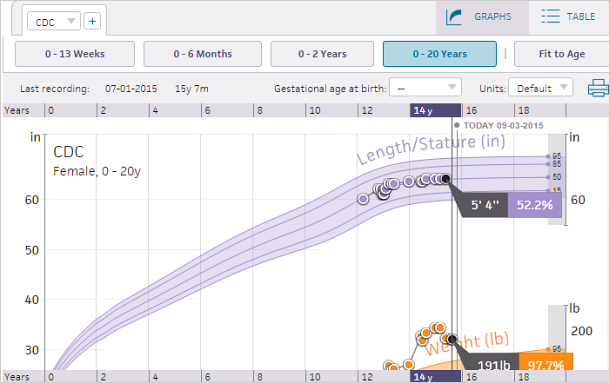
Note: If the patient is under 2 years old, please refer to the WHO chart. If the patient is over 2 years old, please refer to the CDC chart.
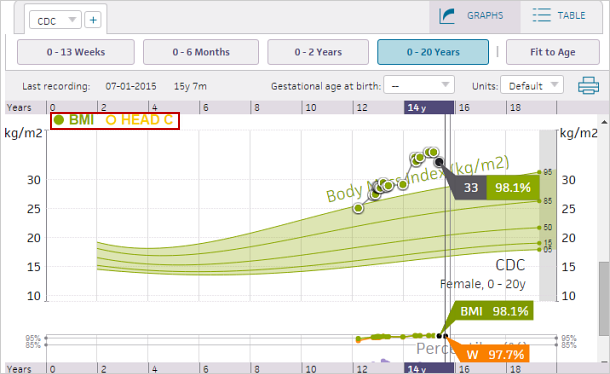
Head circumference appears by default for patients age 0-2 and BMI for patients 2 and older. Click the BMI or Head C option to toggle between the two graphs.
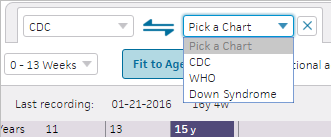
Growth chart selection — You can select the growth chart to view from the Growth Chart menu. By default, the WHO charts appear for patients 0-2 years old, and the CDC charts appear for patients 2 and older. For children with Down Syndrome, you can select Down Syndrome from the menu. Click the plus button to view multiple charts at once, with the second chart displayed in diagonal lines.
Data points — Today's visit is selected by default. Click another data point to view the exact value and percentile. When a data point is selected, hover the cursor over another data point to view the height velocity between the two points.
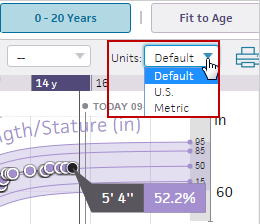
Units of measurement — Measurements use the default units configured for the Vitals section, but you can select Metric or U.S. from the Units menu.
Age range — You can adjust the age range of the growth charts by clicking the age range and Fit to Age buttons.
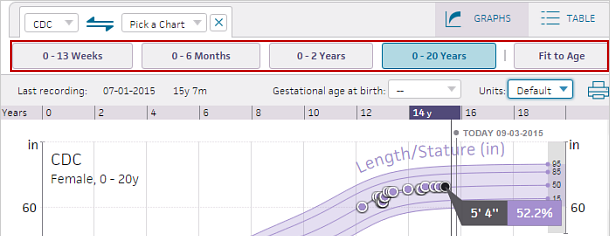
Clicking in the graph and dragging also adjusts the graph to a more specific age range.
Printing growth charts — Click the print icon ![]() to print the growth charts. The print preview displays the growth charts based on the selected charts, age range, and gestational correction. Using the Print Preview window, you can select and display specific data points and toggle between head circumference and BMI.
to print the growth charts. The print preview displays the growth charts based on the selected charts, age range, and gestational correction. Using the Print Preview window, you can select and display specific data points and toggle between head circumference and BMI.
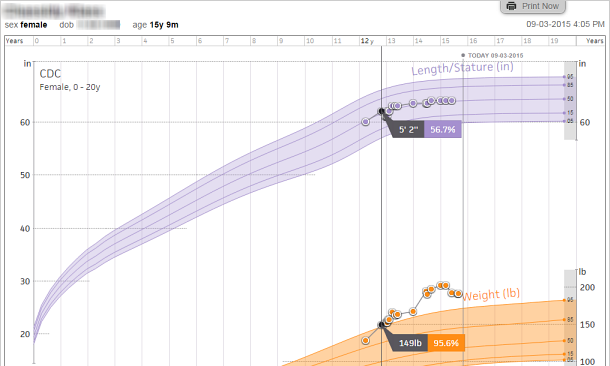
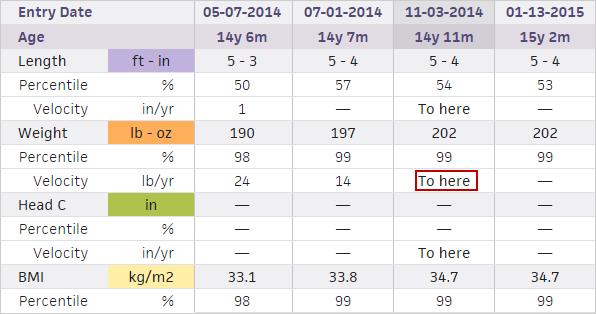
Table tab — The Table tab displays measurements and percentiles for all visits. Click a data point to see the velocity between multiple measurements.
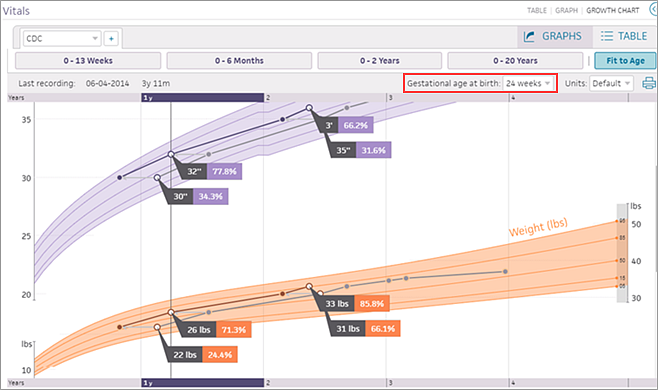
To view gestational correction in the growth charts of premature patients, use the Gestational age at birth menu to select the patient's age at birth.
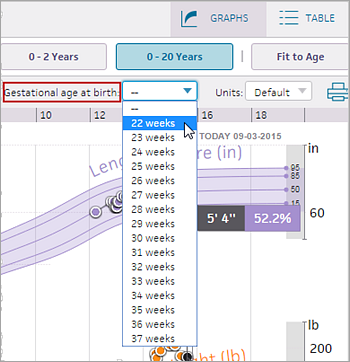
Note: athenaOne saves the last gestational age entered in the chart; all users who view the patient chart see the same adjusted growth curves.
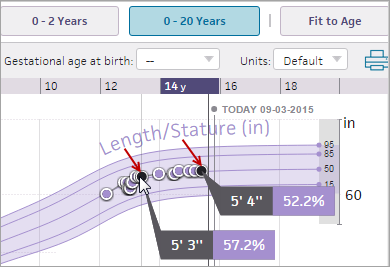
The growth curves are adjusted for gestational age and are displayed with the unadjusted curves on the chart (arrows point from the unadjusted data point to the adjusted data point).
You can view the most recently published Down syndrome (DS) data from the American Academy of Pediatrics (AAP) in interactive growth charts. athenaOne displays data based on Growth Charts for Children With Down Syndrome in the U.S. (Pediatrics, November 2015).
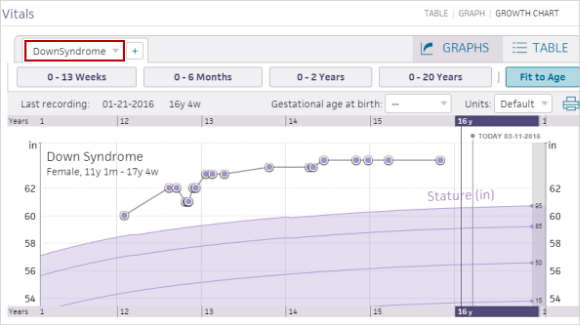
The DS-adjusted growth charts show data for height, weight, head circumference, and BMI. You can view unique data for:
- Male and female patients with DS
- 0-36 month data for weight, height, and head circumference
- 0-20 year data for weight, height, and BMI
Because children with DS tend to follow unique growth trends, you can use the DS-adjusted growth chart to more accurately track the growth of infants, children, and adolescents with Down Syndrome.