Patient Digital Engagement Index (PDEI) Dashboard
athenaCollector, athenaClinicals, athenaCommunicator
Display data related to your practice's patient digital engagement index (PDEI) using this dashboard.
The PDEI indicates how digitally engaged a patient is with your practice. Your PDEI score is influenced by patient behaviors, broken into a few categories:
- Access to care index
- Healthcare finance index
- Healthcare information index
- The PDEI dashboard includes data for both athenahealth and MDP/third-party digital solutions.
Important: Users can only view PDEI data for the context ID in which they are currently logged in. We are investigating how to implement an aggregated view for a parent context to view the data for all child contexts.
The PDEI indicates how digitally engaged a patient is with your practice. Behaviors that influence your PDEI score include when patients
- Digitally confirm or cancel an appointment via online or SMS
- Check in online
- View test results online
- Receive billing statements online
- Book appointments online
- Digitally make a payment (including autopay agreements)
This dashboard allows you to see your overall PDEI score, a breakdown of factors that influence the score (Access to Care, Healthcare Finances, and Healthcare Information), and how this data has trended over time. The data model leverages data sources to allow for greater extensibility and general efficiency.
-
You must have the "Insights Dashboards: Patient Engagement" permission to use this dashboard.
-
To view the PDEI Dashboard for a reporting network, you must have the following permissions:
-
Insights Dashboards: Patient Engagement
-
View Only: Monitor Fee-for-Service Revenue Performance
-
View Only: (Context-level) Benchmarking & Cross-Practice Views (Insights Dashboards)
-
-
To use the network features available in a reporting network, superusers need the following roles or permissions (granted at the reporting network level):
-
Practice Switcher role or permission
-
Enterprise: Network Dashboard role or permission
-
-
The following roles or permissions are recommended to easily navigate the reporting network:
-
Access to all Departments role or permission
-
Access to all Providers role or permission
-
*Billing Admin role
-
- On the Main Menu, click Reports > Insights Dashboards. The Insights Dashboards landing page appears in a new browser tab.
- In the menu bar, hover over Improved Patient Experience and then click Patient Digital Engagement Index.
The PDEI dashboard landing pages displays your practice's overall PDEI score, with trending values vs. the previous month and vs. the same month of the previous year (highlighted below):
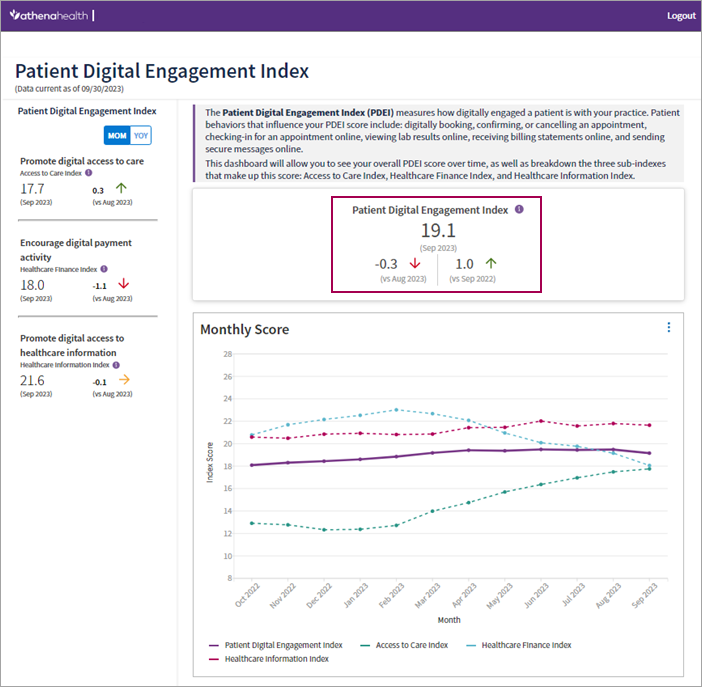
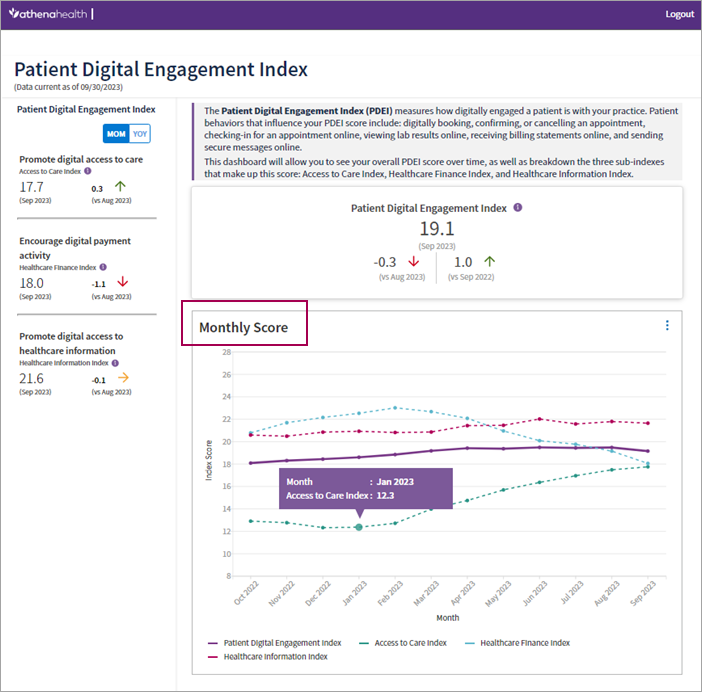
The landing page features a graphical representation of the monthly PDEI score. You can hover over data points to view score values for a specific time:
The left sidebar features the following categories that contribute to the overall PDEI score:
-
Promote digital access to care (access to care index)
-
Encourage digital payment activity (healthcare finance index)
-
Promote digital access to healthcare information (healthcare information index)
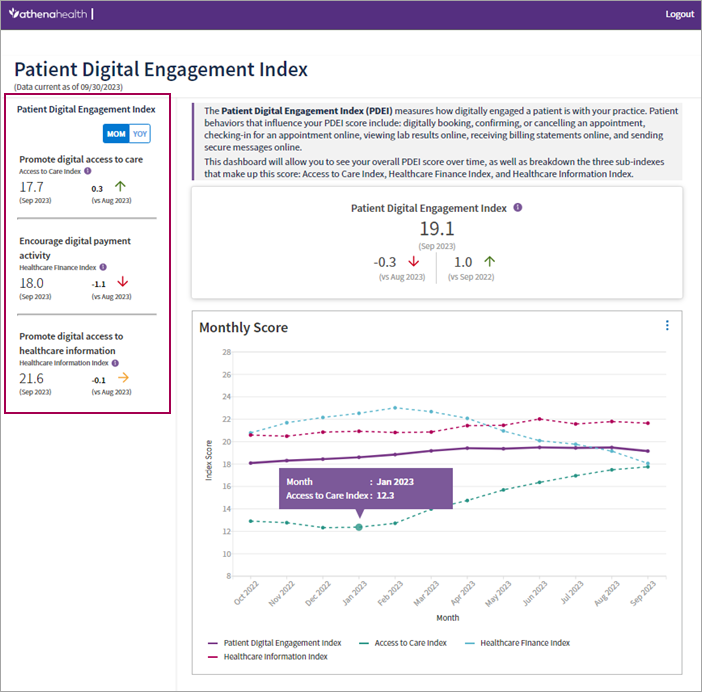
Each category is clickable and provides a unique data view. Jump to this section for more information.
You can toggle these values to display trending information on a month-over-month (MOM) or year-over-year (YOY) basis:
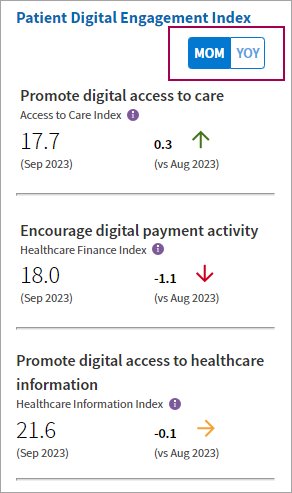
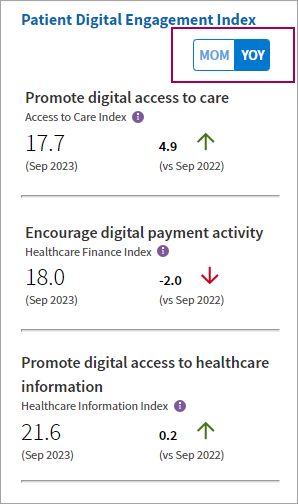
The trending values on the right side of this sidebar change depending on the MOM vs. YOY toggle setting.
Tables below each activity bar graph allow practice users to drill down in to the data that makes up those activities. Specifically, users can select a particular month/year and drill down by department, provider group, specialty, provider, and medical group to view and compare the digital engagement for that activity across their organization.
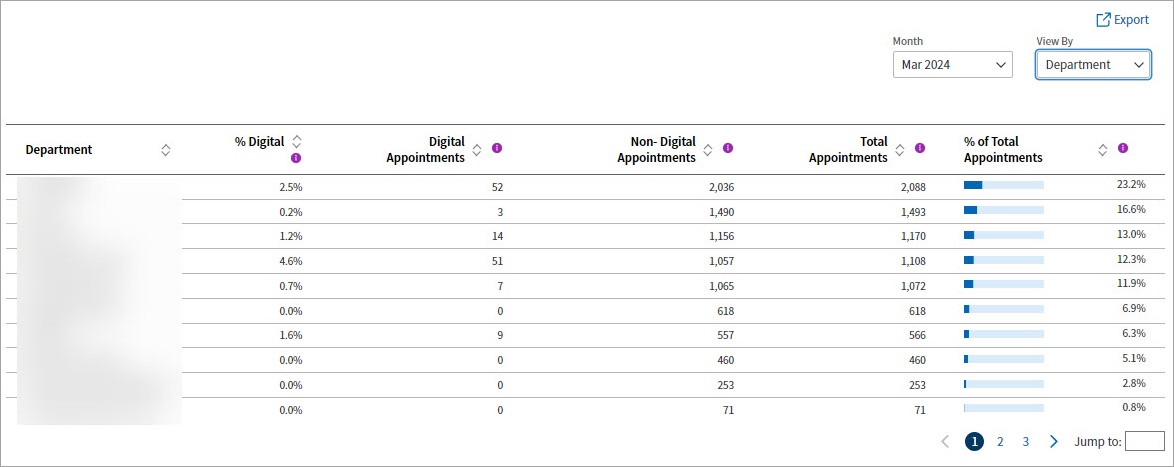
Tip: Hover over the image for an expanded view.
Use the View By menu to specify the data you'd like to view:
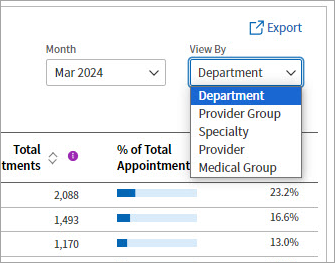
There are similar tables for each activity that is accounted for in the PDEI:
- Access to Care
- Scheduled Appointments
- Confirmed Appointments
- Canceled Appointments
- Healthcare Information
- Viewed lab results
- Check-ins
- Healthcare Finances
- Payments
Your staff can use PDEI benchmarking to compare your organization's PDEI score to other practices in the athenahealth network. This comparison functionality allows staff to gauge performance and set target goals.
When you land on the PDEI benchmarking page, benchmarking information is already selected to display. You can select and deselect information for practices in the 25th, 50th, 75th, and 90th percentiles.
-
From the Main Menu, click Reports.
-
Click Insights Dashboard.
-
Under Improved Patient Experience, click Benchmarking.
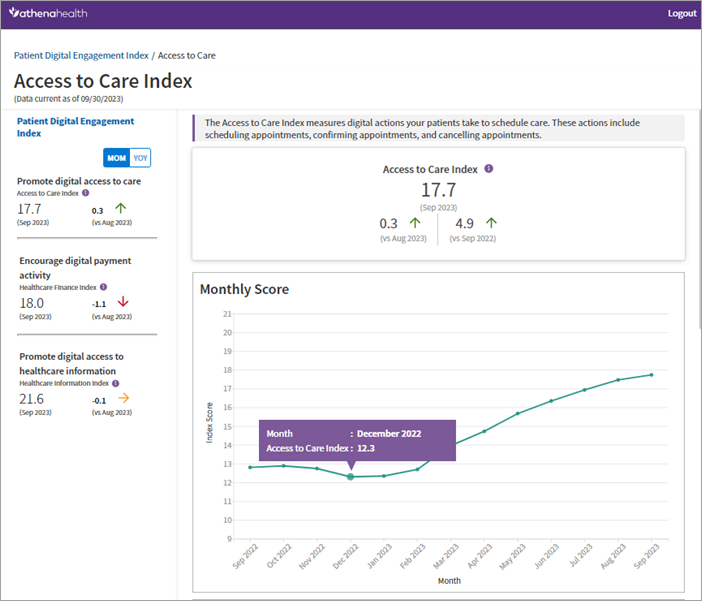
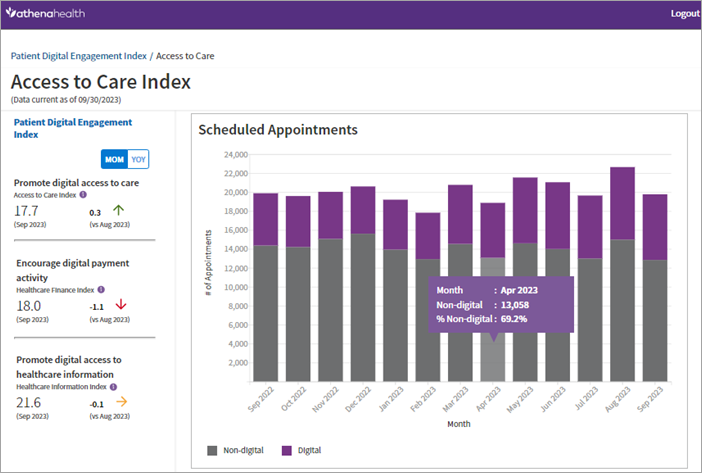
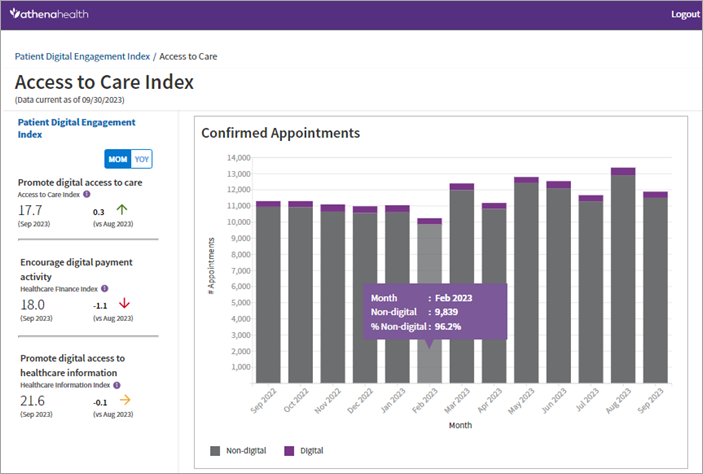
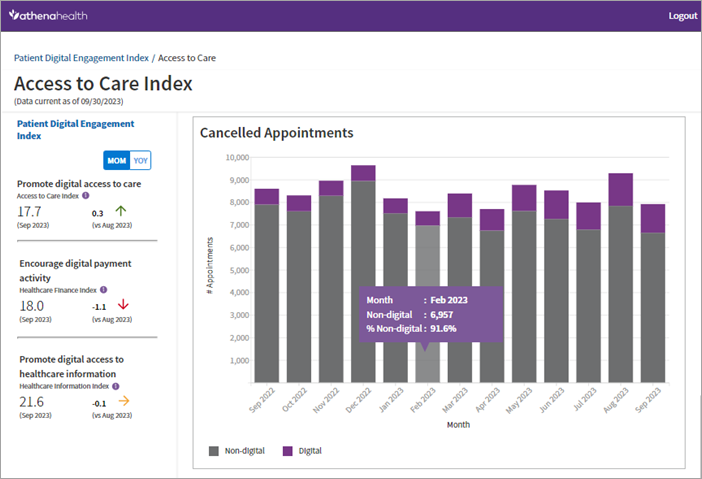
The access to care index measures the actions your patients take to schedule care. This index includes the following metrics:
- Scheduled appointments (non-digital vs. digital)
- Confirmed appointments (non-digital vs. digital)
- Cancelled appointments (non-digital vs. digital)
Clicking Promote digital access to care from the left sidebar displays graphs breaking down these metrics, as well as a monthly score trend. You can hover over data points in each graph to show statistics for a specific point in time.
The images below show each graph, as well as the corresponding hover functionality.
Note: The bars in each graph indicate the volume of interactions for the activity each month. The purple sections represent digital activity and the gray sections represent non-digital activity.
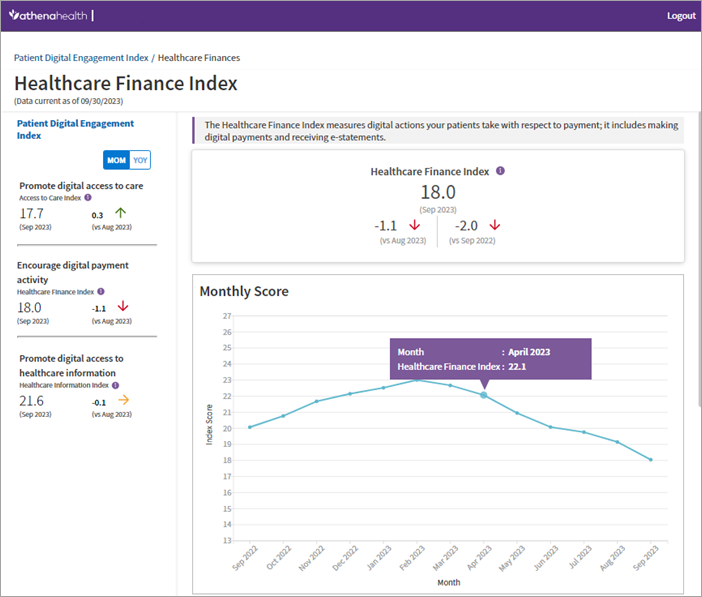
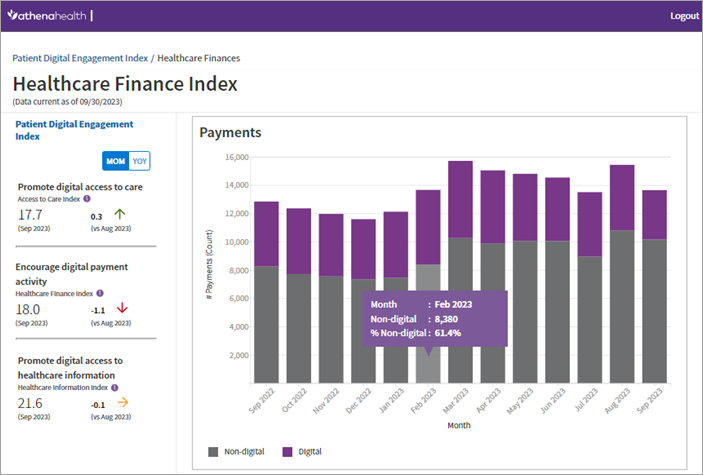
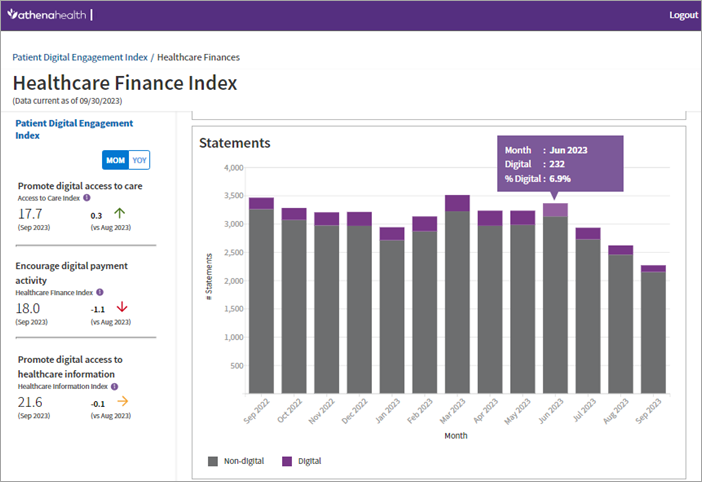
The healthcare finance index measures the actions your patients take regarding payments. This index includes the following metrics:
-
Making payments (non-digital vs. digital)
-
Receiving payment statements (non-digital vs. digital). An e-statement qualifies as a digital statement.
Clicking Encourage digital payment activity from the left sidebar displays graphs breaking down these metrics, as well as a monthly score trend. You can hover over data points in each graph to show statistics for a specific point in time.
The images below show each graph, as well as the corresponding hover functionality.
Note: Receiving only e-statements qualifies as a digital statement.
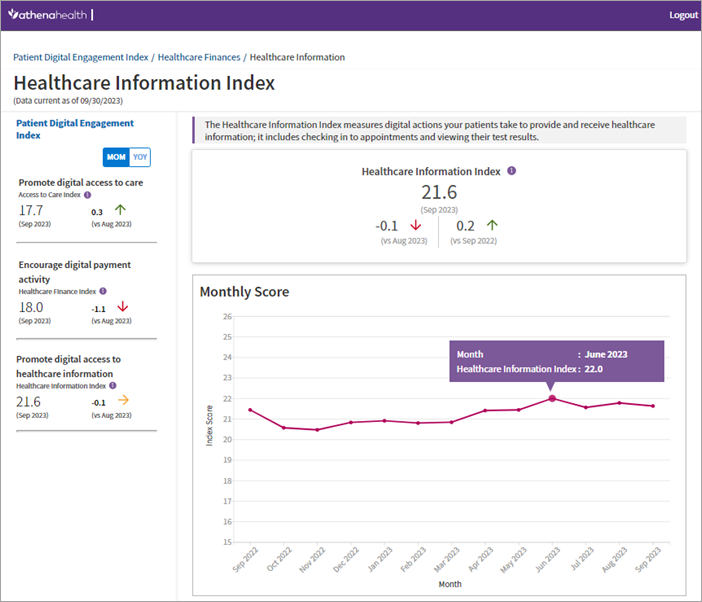
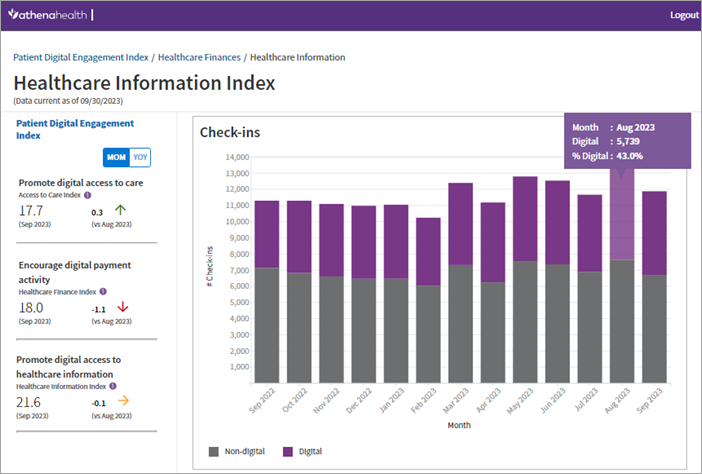
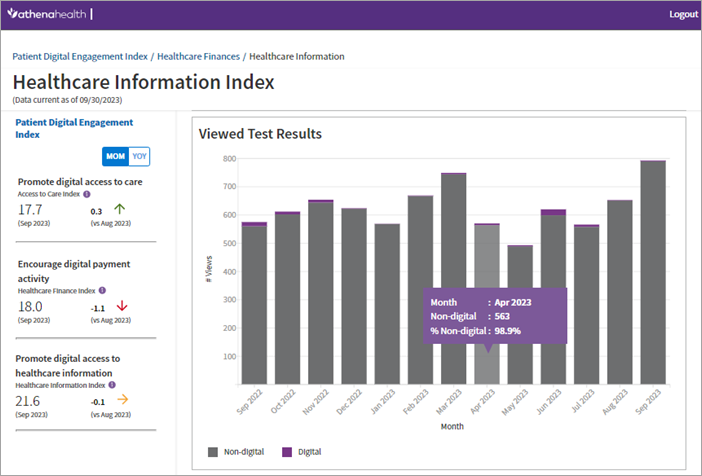
The healthcare information index measures the actions your patients take regarding providing and receiving healthcare information. This index includes the following metrics:
-
Appointments check-ins (non-digital vs. digital)
-
Viewed test results (non-digital vs. digital)
Clicking Healthcare information index from the left sidebar displays graphs breaking down these metrics, as well as a monthly score trend. You can hover over data points in each graph to show statistics for a specific point in time.
The images below show each graph, as well as the corresponding hover functionality.
Large organizations can see the PDEI scores for all contexts in their reporting network. Check User access and permissions to see if you can access this view.
From the PDEI landing page, click the View Cross-Practice (Reporting Network) View link. You will only see this link if you are part of a reporting network.
This view contains the same reporting metrics found on the main PDEI Insights dashboard.
The network ID is displayed, and you can adjust data by two filters:
-
Parent Context ID
-
Context ID
The option you select for Parent Context ID determines the options you can select under Context ID.