athenaOne® Medical Coding Performance Dashboard (for ambulatory customers)
athenaCollector + athenaClinicals
This dashboard is available to ambulatory customers who have contracted with athenahealth for athenaOne Medical Coding services.
The athenaOne® Medical Coding Performance Dashboard provides transparency into key performance indicators (KPIs) related to the athenaOne Medical Coding service, including:
- Service utilization rate
- Turnaround times
- Amount of work done by athenahealth's coding team independently
- Amount of work where the coding team needed your practice's assistance
- Time to Bill
- Evaluation and Management (E&M) distribution
- On the Main Menu, click Reports. Then click athenaOne Medical Coding Performance.
The athenaOne® Medical Coding Performance Dashboard appears in a new tab. - On the Main Menu, click Reports > Insights Dashboards. The Insights Dashboards landing page appears in a new browser tab. In the menu bar, hover over Less Work and then click athenaOne® Medical Coding.
- This dashboard is available to ambulatory customers who have contracted with athenahealth for athenaOne Medical Coding services.
- To access the athenaOne Medical Coding Performance Dashboard, you must have the Coding Services: Dashboard role.
The athenaOne® Medical Coding Performance Dashboard provides transparency into key performance indicators (KPIs) related to the athenaOne Medical Coding service, including:
- Service utilization rate
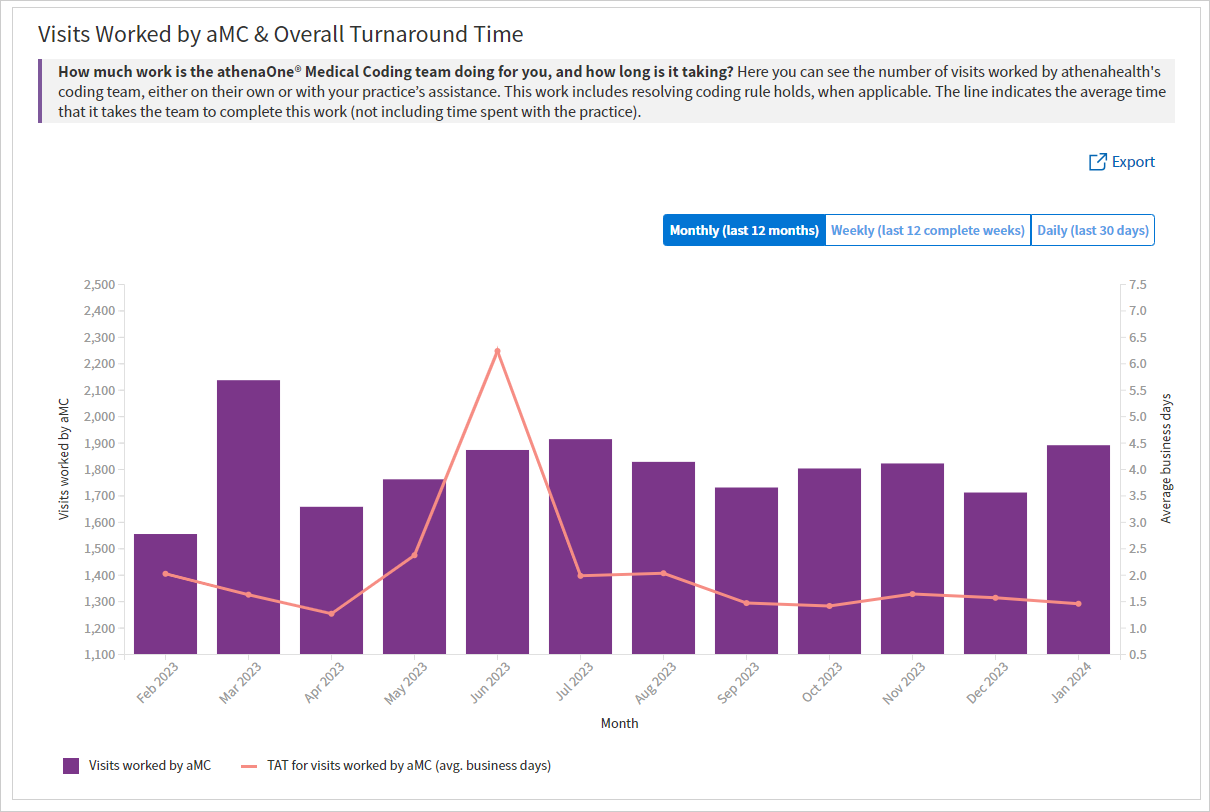
- Turnaround times
- Amount of work done by athenahealth's coding team independently
- Amount of work where the coding team needed your practice's assistance
- Time to Bill
- Evaluation and Management (E&M) distribution
Note: Dashboard metrics are refreshed by 9:00 a.m. EST daily. The latest dashboard refresh date appears on each dashboard.
For additional information about athenaOne Medical Coding , see the User Guide — athenaOne Medical Coding (for ambulatory customers)
The athenaOne Medical Coding Performance Dashboard includes the following sections:
- Filters
- Performance at a glance
- Metrics charts and graphs
- Metrics details
- Left panel with highlighted metrics and links to focused dashboard views
- Insights
 Filters
Using the filter fields, you can filter data on the dashboard, by:
- Department
- Payer (Insurance Reporting Category)
-
Payer (Insurance Package)
-
Supervising Provider Group
-
Supervising Provider
-
Supervising Provider Specialty
To display the filter fields on the dashboard, click Filters at the top right of the dashboard.

- Click any filter field to display the filter options. Select the filters that you want from the list and click Apply. The filtered results appear immediately on the dashboard.
- Click Clear all to remove all filters that were previously selected.
 Performance at a glance
Key metrics at the top of the dashboard show how athenaOne Medical Coding is working on your behalf.
| Metric | Description |
|---|---|
| Utilization Rate | Percentage of service-eligible visits that were sent to Medical Coding (and then billed) |
| Medical Coding Worked Independently (%) | Percentage of visits sent to Medical Coding (and then billed) that were coded without needing assistance from your practice |
| Medical Coding Worked Independently TAT (Days) | Average number of business days it takes for Medical Coding to code a visit when no assistance is needed from your practice |
Tip: Click the image to see an expanded view
 Metrics charts and graphs
Charts and graphs of your organization's performance over time help you visualize the data and compare performance between the current period (day/week/month) and previous periods.
Tip: Click the image to see an expanded view
To export data from a table or chart:
- Click the export icon
 — located at the top right of each table and chart — to download the data to a CSV file.
 Metrics details
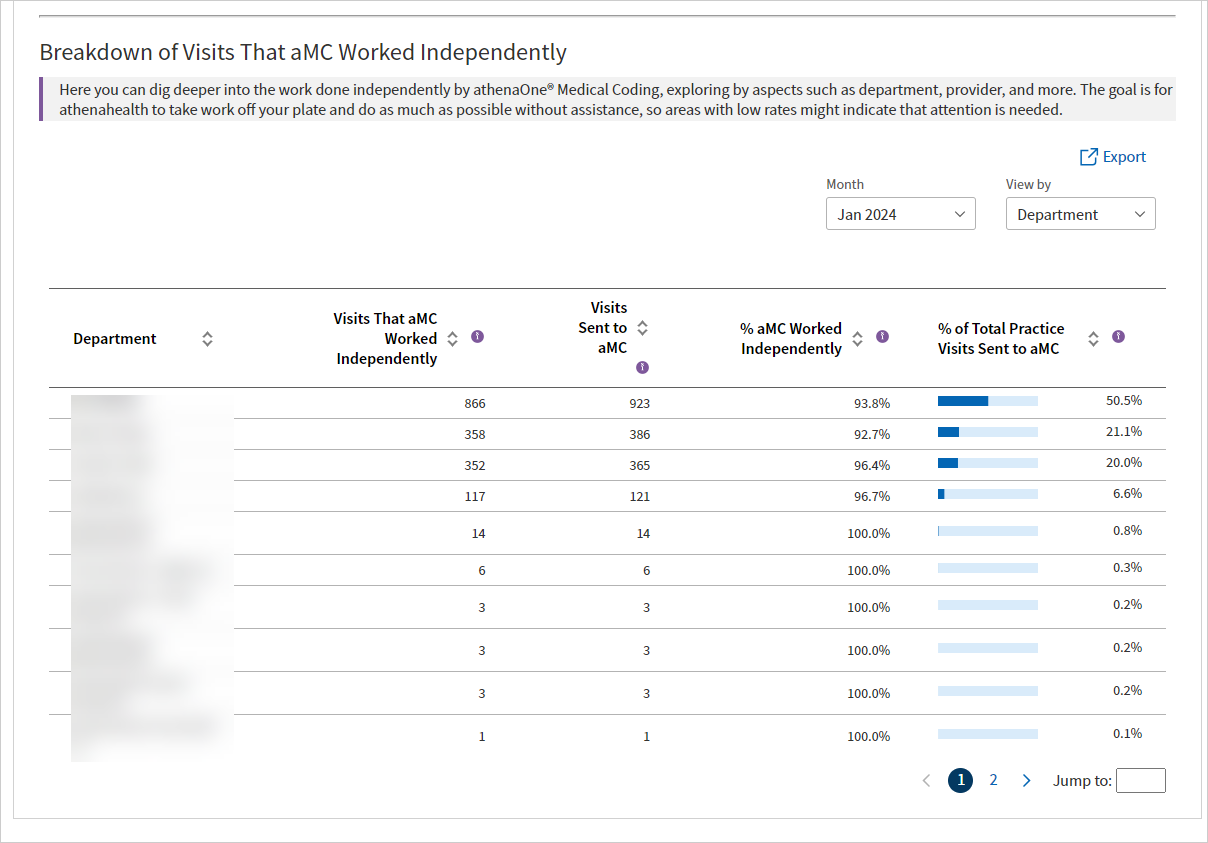
Several charts or graphs have a breakdown table directly below them, allowing a more focused or filtered look at the same data.
- Hover over a metric name with a dotted underline to read each metric definition.
- Click the sort icon
 to sort by a specific column
Tip: Click the image to see an expanded view
 Ways to improve
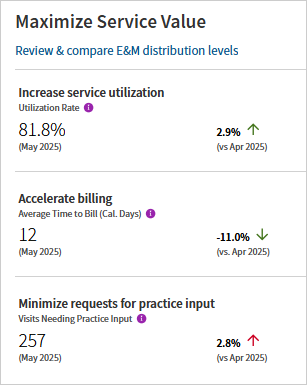
On the left side of the dashboard, you can see ways to Maximize Service Value, with key performance indicators for each action.
Click a performance area to view a dashboard that focuses on that specific metric, to help you understand the drivers for that performance indicator.
- Review & compare E&M distribution levels
- Increase service utilization
- Accelerate billing
- Minimize requests for practice input

 Insights and guidance
Clicking the Insights button on the right side of the page provides information about how to interpret the performance data and how to improve performance.


