Patient Population
athenahealth Population Health
You can use the Patient Population page to analyze your organization's patient population. You can also:
- Access patient or PCP data
- Export a patient panel to Excel
- Add a care management program referral
On the Main Menu, click Patients and select Patient Population
On the Main Menu, enter the patient's name, patient ID, or member ID (insurance number) in the Search Bar. Under NETWORK PATIENTS, select the data type and then click the search icon.
Your organization must have the Population Health service enabled, and you must have one of the following roles (these roles include the Population Management: Patient Population permission needed to access the Patient Population page).
Assign this role to care managers.
This role allows you to:
- Access the Patient Population page
- Identify a group of patients for the a care management program
- Access a patient's Person Center
- Access a provider's PCP Center
Assign this role to members of care teams.
This role allows you to:
- Access the Patient Population page
- Identify a group of patients for a care management program
- Access a patient's Person Center
Assign this role to quality managers.
This role allows you to:
- Access the Patient Population page
- Identify a group of patients for a care management program
- Access quality data on a patient's Person Center
- Access a provider's PCP Center
Assign this role to analysts.
This role allows you to:
- Access the Patient Population page
- Identify a group of patients for a care management program
- Access quality data on a patient's Person Center
- Access a provider's PCP Center
Assign this role to non-care managers, such as office staff, who need to identify patients for care management programs.
This role allows you to:
- Access the Patient Population page
- Identify a group of patients for a care management program
- View the Care Management tab in the Person Center
- To view the Severity tab, you must have the Population Management: View Milliman Data role.
- To view the Ingenix tab, you must have the Population Management: View Ingenix Data role.
- On the Main Menu, enter the patient's name, patient ID, or member ID (insurance number) in the Search Bar. Under NETWORK PATIENTS, select the data type and then click the search icon.
The Patient Population page appears, with the matching patients listed under the Patients tab. - You can click a patient name to expand the details, and then click on the large text patient name to display the patient's Person Center.
- Display the Patient Population page: On the Main Menu, click Patients and select Patient Population. The Population tab is selected by default.
To filter by PCP, Payer, Quality Test, or Medicare Data Provider
- Click the Add Filter icon
 at the top of the page.
 - Select an option, and then click Apply.
To filter by the filter sets
- Scroll to a filter set of interest, for example, Care Management.
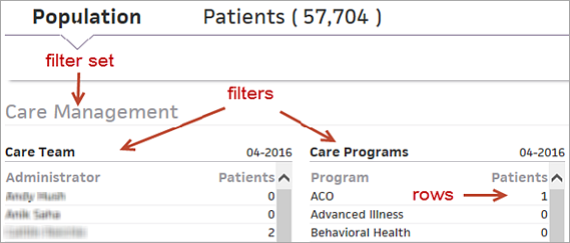
- Click a row of the filter of interest. For example, for the Care Programs filter in the Care Management filter set, click the ACO row to filter by patients with ACO.
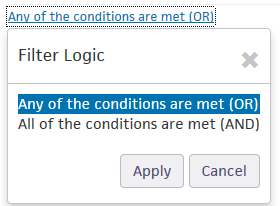
- You can select additional filter rows, select (AND) or any (OR) of these filters. The default is OR. You can click Any of the conditions are met (OR) to display the filter logic options.
Select All of the conditions are met (AND) to filter for all selected filter rows. - Click Apply.
- Apply additional filters as desired.
The page is recalculated to show all metrics related to the filtered set of patients.
- Display the Patient Population page: On the Main Menu, click Patients and select Patient Population.
- Click the Patients tab.
- Check the boxes for the desired patients, or click Select All.
- Click Export Selected or Export All at the top of the page.
- Display the Patient Population page: On the Main Menu, click Patients and select Patient Population.
- Narrow the list of patients using the filter fields.
- Click Apply Filters.
- Select a group of patients:
- To select individual patients, check the boxes next to their names.
To choose all patients (that is, all patients in the search results, even if your search results span multiple pages), leave all checkboxes blank.
-
Click Add Program Referral.
The Add New Program Referral window appears.
Note: After you select a program, the number of eligible patients appears next to the number of patients that you selected for the program referral. A program referral is not created for ineligible patients (that is, patients who already have an active status in that care management program). - Status — Select Identified.
- Complete the other required and optional fields, noting the following:
- The program referral must have the same data for all patients.
- Program — Patients who already have an active status (that is, Identified, Pending, Scheduled, or Enrolled) for a program appear as ineligible.
- Assigned To — The selected user is added to the patient's Care Team.
- Focus problem(s) — Recommend one or more focus problems.
These focus problems do not appear on the patient's care plan because they are only the recommended focus problems.
Note: You must display the Focus problem(s) list each time you add another focus problem. As you add focus problems, a tally of the selected focus problems appears in this field (for example, "3 selected"), and the selected focus problems appear highlighted in blue in the list. You can click a focus problem highlighted in blue to deselect it.
- Check the box for "I confirm that I want to create new program referrals for [#] patients."
- Click Save.
- Display the Patient Population page: On the Main Menu, click Patients and select Patient Population.
- Apply any necessary filters:
- Click the plus icon
 next to FILTER at the top of the page.
 - Select filters and click Apply.
- Click the plus icon
- Check the box in the last column for the patients for whom you want to download provider care summaries.
If you select at least one patient, Generate C-CDA For Selected appears at the bottom of the page.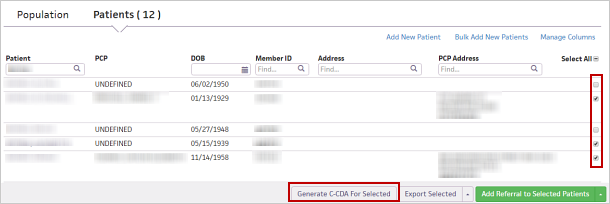
- Click Generate C-CDA For Selected.
Note: For bulk download of patients' care summaries in CCDA format, all the patients' care events are included, as well as each patient's contact information, PCP name, medications, problems, labs, and plan of care. - The document, which downloads as a .zip file containing multiple .xml files, is stored in your computer's Downloads folder.
- Display the Patient Population page: On the Main Menu, click Patients and select Patient Population.
- Click the Patients tab.
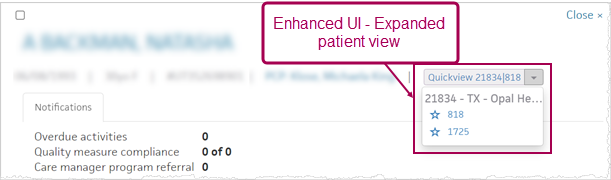
- Click Quickview below the patient name.
Note: This drop-down appears only for patients who also have records in athenaClinicals. You can choose the desired clinical patient ID from the Quickview drop-down menu. You can mark only one patient ID as your favorite by clicking the star icon next to the patient ID. Clinical patient IDs are grouped by Practice Name and sorted in ascending order by Practice ID and then Patient ID.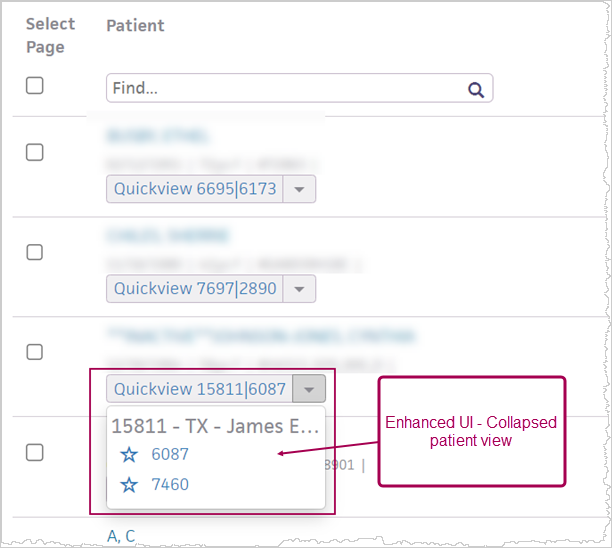
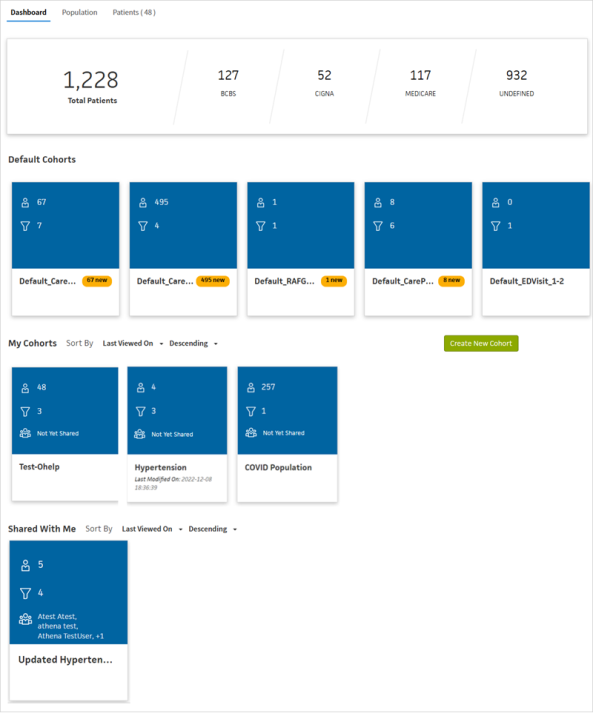
On the Dashboard tab, you can save a filtered population criteria as a custom cohort. You can modify the criteria and share with multiple users.
This tab displays four sections:
- Total Patients - This section displays the total patient count managed by your context along with payer patient counts.
- Default Cohorts – This section displays five different cohorts by default. These default cohorts are set up based on the common population filter criteria used often by different users. The filter criteria for these default cohorts are fixed and cannot be modified.
- My Cohorts - This section displays the custom cohort boxes. Custom cohorts are filters that you can define or customize as per required population criteria to identify a subset of patients matching the criteria.
- Shared With Me – This section lists the cohort boxes that are shared with you. You only have read-only access to these cohorts and cannot modify them. The Last Modified time frame note in the cohort box indicates the time that the owner has updated the filter criteria.
Each cohort box listed in the Dashboard tab of the Patient Population page displays these icons representing specific cohort details.
| Icon | Represents |
|---|---|
|
|
This icon displays the number of patients / population matching the cohort criteria. |
|
|
This icon displays the number of criteria used in the cohort to filter the subset of population. You can hover over the number to view the defined criteria. |
|
|
This icon displays the name of users with whom the cohort has been shared. |
|
|
This icon displays the number of new population matching the cohort criteria since the last time you have accessed the cohort. |


You can create and save a cohort to avoid recreating the same patient filter criteria on repeated login.
- Click the Create New Cohort button under the My Cohorts section. The Population tab appears.
- Select the required criteria under the available categories to filter the subset of relevant patients. You can also apply global filters
 available on the top of the page.
 - Enter the name of cohort in the Enter Cohort Name field and click Save Cohort.
Note: Multiple cohorts cannot be created with the same name. - A pop-up message for successfully saving the cohort details appears. Click OK.
- You can view the newly created cohort under the My Cohorts section.
You can modify the filter criteria for a cohort that you own by following these steps:
- Click on the cohort box that you want to modify from the Dashboard tab. The Population tab with the existing filter criteria of the selected cohort appears.
- Modify the filter criteria as required. You can add or remove filters against different categories available. You can also combine and apply global filter criteria available on the top of the page.
- Click Save Cohort to apply the changes to existing cohort. A pop-up message for successfully saving the modified cohort details appears. Click OK.
- The cohort box in Dashboard tab now displays the Last Modified time frame. The
 icon also displays the change to filter criteria count.
 - Alternatively, you can click Save As New Cohort to create a new cohort by re-using the criteria of an existing cohort along with the changes that you applied. Enter a name for the new cohort in the dialog box pop-up and click Save.
- The newly created cohort box gets added to the My Cohorts section in the Dashboard tab.
- To delete a cohort that you own, click on the cohort box that you want to delete.
- From the drop-down menu next to the cohort name, choose the Delete Cohort option.
- Click OK in the pop-up message to confirm deletion.
- The deleted cohort gets removed from the My Cohorts section in the Dashboard tab. If you have previously shared the cohort with any user, the cohort gets deleted from their shared list as well.
You can share a cohort that you have created with any number of users within the same practice / context by following these steps:
- Click on the cohort box that you want to share.
- From the drop-down menu next to the cohort name, choose the Share Cohort option.
- The Share with pop-up opens, from which you can select the username(s) you wish to share the cohort with. Select the checkbox(es) against the username(s) and click Share.
- You are now prompted with a pop-up message for successfully sharing the cohort details. Click OK.
- The cohort box listed in the My Cohorts section of Dashboard tab now displays the username(s) with whom you have shared the cohort details against this icon.
Note:You can only share a cohort that you own. You cannot share a cohort that is shared with you, as you do not own it.
You can sort the cohort boxes listed under My Cohorts section and Shared With Me section. There are three options by which you can sort the cohorts and then choose to list them Ascending or Descending.
You can choose this option to list the cohorts based on the access time of cohort. This helps you to find out the cohort that was recently accessed or the one that was accessed long ago.
You can choose this option to sort the cohorts based on the number of times a cohort has been accessed. This helps you to determine the most accessed cohort or the least accessed one.
You can use this option to sort the cohorts alphabetically based on the names either from A-Z or Z-A.
The Patient Population page contains a series of filter sets that display high-level data about your entire patient population. Click a row to filter the entire page as well as the patient list.
Each filter set is a table containing data about your patient population. Each row is a filter, so you can filter the Patient Population page as well as the patient list as needed. For example, a row in the Age filter set shows how many of your patients fall into the 76-85 years of age range. Click the number of patients in the 76-85 age bracket to filter the entire page; you then see information for patients between 76 and 85 years old only.
All the filter sets have OR logic by default. This means that any time you click more than one row in a filter set, you are calculating a list of patients that meet any of the conditions chosen in the filter set. For instance, if you select Diabetes and High Cost (50K) in the Populations filter set, the patient panel lists patients who have diabetes OR are high cost.
Many filter sets have the option to switch to AND logic. This means that if you switch the logic to (AND) and select Diabetes and High Cost in the Populations filter set, the patient panel lists patients who have diabetes AND are high cost.
The filter sets are divided into sections.
These filter sets show a count of patients that fall into different age brackets, and the number of patients listed as male, female, or undefined, as well as how many patients are in each disease population as determined by your organization. The filter sets also show the At Risk count for your organization. These filter sets show the counts based on the most recent athenahealth Population Health information.
The filters in this section are:
The Quality filter set displays a count of care gaps for a quality program. For example, the 1-3 row in the NCQA-HEDIS filter shows the number of patients "not satisfied" for between 1 and 3 quality tests.
Click the 1-3 row to filter the entire page on patients with three or fewer care gaps. The measure year for these filters is the same as the default date used to calculate the metrics as determined by your organization.
The filters in this section vary, but may include NCQA-HEDIS and CMS-ACO.
The Care Management filter set shows the most recent information related to care management, including the number of patients in each care management status as well as the number of patients included in each program and focus problem.
The filters in this section are:
- Care Teams
- Care Programs
- Care Program Status
- Care Focus Problems
- Care Patient Priority
You can also utilize the 'PHQ‑9 > 9' filter criteria to track patients whose most recent PHQ‑9 score within the last 90 days is 10 or higher. This filter helps to identify individuals with elevated depression risk (moderate-to-severe depression symptoms) for outreach, care management, and quality tracking.
Utilization filters only display for clients for whom athenahealth receives admission, discharge, and transfer data. These filters display the most recent counts of patients based on their utilization data. The data displayed here refers to the number of emergency room visits, hospital admissions, and re-admissions experienced by patients in your population.
The filters in this section are:
- Inpatient Admissions
- Inpatient Discharge
- Re-admissions (within 30 days)
- ED Visits
The Worklist filter set displays the number of patients for whom there is an incomplete or overdue task. By default, this shows both care event and quality task statuses for your organization. Use the Module filter to change the selection to show just care events or just quality tasks.
There is one filter in this set:
- Inbox
The filter in the Outreach Manager filter set is called Outreach Channels. You can filter by the type of contact information (email, SMS, phone numbers, patient portal) received from your data feeds, to show the kinds of messages you are able to send to patients via outreach campaigns, and helps give you a preview of how effective campaigns might be in certain populations.
There is one filter in this set:
- Outreach Channels
Risk filters appear if your practice uses Milliman severity data. The Risk filter set allows you to stratify patients by risk. The Retrospective Severity filter allows you to filter patients by a range of retrospective severity scores and by month-year, so you can refer them into care management easier.
There is one filter in this set:
- Retrospective Severity
You can use the Patient Population page to identify patient populations at higher risk for COVID-19 (COVID-19 AT RISK FOR MORE SEVERE ILLNESS) and populations with confirmed cases of COVID-19 (COVID-19 CONFIRMED CASES).
COVID-19 AT RISK FOR MORE SEVERE ILLNESS
This population identifies patients, based on the CDC guidelines, at higher risk for severe illness from COVID-19.
athenahealth uses MARA clinical classifications and SNOMED codes mapped to the following conditions and other risk factors based on CDC guidelines to identify this population:
- Asthma
- Chronic kidney disease being treated with dialysis
- Chronic lung disease
- Diabetes
- Immunocompromised
- Liver disease
- People aged 65 years and older
- Serious heart conditions
- Severe obesity
COVID-19 CONFIRMED CASES
| Code Set | Code | Description |
| SNOMED | 840533007 | Severe acute respiratory syndrome coronavirus 2 |
| SNOMED | 840539006 | Disease caused by severe acute respiratory syndrome coronavirus 2 (disorder) |
| ICD-10 | U07.1 | COVID-19 |
At the top of the page, click the Patients tab to select the patient panel based on the filters selected. Notice that as you select filters, the count of patients at the top of the page changes.
You can search for patients as well as check the box next to individual patients (or Select All) to identify patients for a care management program or include them in an Excel spreadsheet. An action bar across the bottom of the page provides options to Export All, Export Selected, or Add Program Referral.
Click a patient in the list for an expanded view of the patient that includes activities and care team members. Click the patient's name again to display the patient's Person Center. Click the patient's PCP name to display the PCP Center or PCP Performance Dashboard for that provider.
| Add New Program Referral window | |
|---|---|
| Program |
Select a program from the list. |
| Date referred |
Today's date automatically appears in this field, but you can select a different date if needed. |
| Referred by |
Select one of these options to indicate who referred the patient to the care management program. |
| Optional fields | |
| Assigned to |
Select which member of your organization will monitor the patient's progress in the care program. Note: The selected user is added to the patient's Care Team. |
| Referral note |
Enter a note to document any additional details about the patient's referral to this program. |
| Status |
"Identified" automatically appears in this field when you add a new program. Note: Although you can select a different status in this field when adding a new program referral, you will skip steps in the program enrollment process. |
| Date updated |
Today's date automatically appears in this field, but you can select a different date if needed. |
| Status note |
Type any notes related to the selected status. |