PCP Performance Dashboard
athenahealth Population Health
|
The PCP Performance Dashboard is being deployed to all athenahealth Population Health organizations. If your organization has not yet received the PCP Performance Dashboard, see the O-help page about the PCP Center. |
The PCP Performance Dashboard enables providers and administrators to view PCP performance across metrics and across the network. A primary care provider (PCP) can be a physician, practice, or group. The term "network" means the entire list of providers in the organization's PCP hierarchy.
Data View is now the self-service reporting solution which provides a secure and efficient direct database connection to your population health data. The clinical population data views provide improved data filtering capabilities and enhanced metric visualization.
On the Main Menu, click Reports. Under POPULATION MANAGEMENT, click PCP Performance Dashboard
On the Main Menu, click Reports. Under POPULATION MANAGEMENT, click PCP List. Click a PCP name in the list
Your organization must use athenahealth Population Health, and you must have the Population Management: View PCP Center role.
To display the PCP Performance Dashboard, you must select a PCP.
- Display the PCP Performance Dashboard: On the Main Menu, click Reports. Under POPULATION MANAGEMENT, click PCP Performance Dashboard.
- Level 1 — Select a group from the list.
The practices associated with the level 1 group appear under Level 2.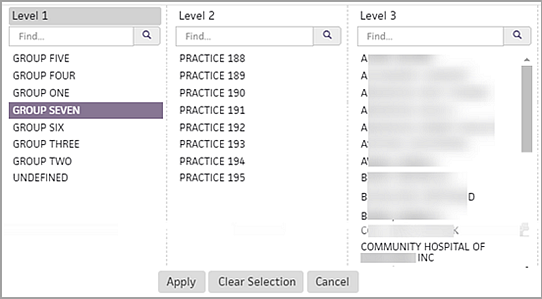
- Level 2 — To report on only one practice in the level 2 list, select the practice from the list.
The providers associated with the level 2 practice appear under Level 3. - Level 3 — To report on only one provider in the level 3 list, select the provider from the list.
- Click Apply.
The PCP Performance Dashboard for the selected provider appears. - To save the filters for future use:
- Click the History icon
 at the upper left of the window.
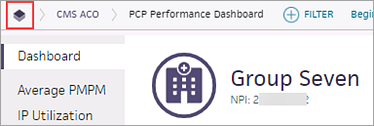
A list of recently viewed pages appears. - Click the star icon
 next to the view you want to save.
 - Page Name — Enter a name for the filter set and click Done.
The filters you saved will be available the next time you log in.
For information about the Quality Metrics card, see "To view Quality metrics on the PCP Performance Dashboard."
- Display the PCP Performance Dashboard: On the Main Menu, click Reports. Under POPULATION MANAGEMENT, click PCP Performance Dashboard.
- Select a PCP using the PCP filter selection panel and click Apply.
The PCP Performance Dashboard appears. - To see the Detail view of a metric, click the metric card on the Dashboard, or click the metric name on the left side of the window.
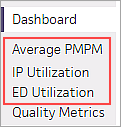
The Average PMPM, IP Utilization, or ED Utilization Detail view appears.
For more information about each Detail view, see "PCP Performance Detail views." - On the Detail metric card, you can hover the cursor over a data point on the graph to see detailed information.
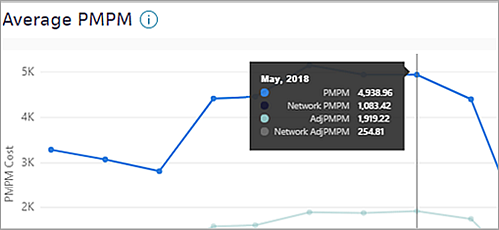
Note: Click the information icon to the right of the metric name to display the definition of the metric.
Metric card table
- To see more information, scroll down to the Details table below the graph.
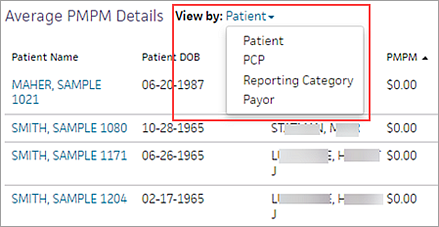
The Details tables for Average PMPM, IP Utilization, and ED Utilization have a default view, but you can select a different view of the data. - View by: — Select an option from the menu.
- Patient — To see which patients have the highest PMPM, inpatient utilization events, or emergency department visits.
- PCP — To see which PCP's population has the highest PMPM, inpatient utilization events, or emergency department visits.
- Reporting Category — To see the PCP's PMPM spend by reporting category (Average PMPM card only).
- Payor — To see the PMPM spend by payer (Average PMPM card only).
- Facility — To see which locations or facilities have the most inpatient utilization events (IP Utilization card only).
- To add or remove columns from the Details table:
- Click Manage Columns.
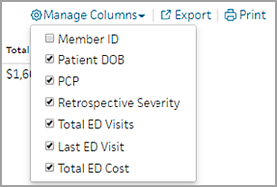
- Select and deselect columns in the list.
- To export the data to a .csv file, click Export.
- To send the data to a printer, click Print.
Note: The list of columns depends on the metric card and the selected view of the card.
The Quality Metrics card displays the ratio of completed-to-incomplete quality measures for each quality management program your organization is enrolled in. The data is filtered for the PCP you selected when you displayed the PCP Performance Dashboard.
Note: The quality metrics shown on the PCP Performance Dashboard are the same quality metrics displayed on the Quality Manager page.
- Display the PCP Performance Dashboard: On the Main Menu, click Reports. Under POPULATION MANAGEMENT, click PCP Performance Dashboard.
- Select a PCP using the PCP filter selection panel and click Apply.
The PCP Performance Dashboard appears. - Click the Quality Metrics card on the Dashboard, or click Quality Metrics on the left side of the window.
The Quality Metrics card appears.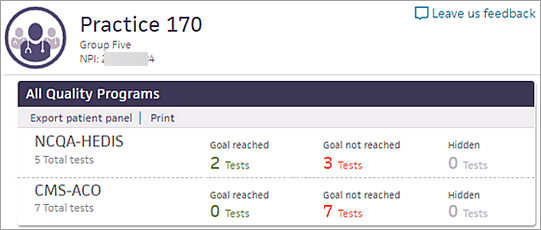
- To display individual measures for the patient panel, click # Tests under the Goal reached or Goal not reached column.
- Click a measure in the list to display the Quality Manager Details page.
The list of patients satisfied, not satisfied, and excluded for the measure appears.
The PCP Performance Dashboard enables providers and administrators to view PCP performance across metrics and across the network.
Note: A primary care provider (PCP) can be a physician, practice, or group. The term "network" means the entire list of providers in the organization's PCP hierarchy.
On the PCP Performance Dashboard,
- Providers can see utilization and quality data to achieve better outcomes for populations.
- Analysts can generate performance reports for providers.
For example, an analyst can see how the rates of emergency department visits for a group compare to the ED visits for the network over the past six months. That analyst can use the list of patients who frequent the emergency department to advise their PCPs about opening their schedules to improve in-office appointment availability.
Note: In a future release, the PCP Performance Dashboard will replace the PCP Center that appears when you click a PCP name in a report or in a patient's Person Center.
The PCP Performance Dashboard provides the following metrics.
The Average PMPM (per member per month) metric shows the average cost of care for the selected provider's patient panel during the selected date range compared to other providers. This metric can highlight items that are driving the highest costs for the network. Lower PMPM costs are desirable.
To calculate the average PMPM, the patient panel's total medical costs and script costs are divided by total member months:
Average PMPM = (Medical Cost + Script Cost) / Member Months
The Inpatient (IP) Utilization metric comprises admissions per thousand (Admits/K) and readmission rates.
IP Admits/K
The Admits/K (admissions per thousand) metric shows the inpatient admissions for a selected provider's patient panel compared to other providers during the selected date range. To account for differing panel sizes, the metric uses normalized admission numbers. Lower admit numbers are desirable.
To calculate the IP Admits/K, the current year-to-date admissions value is annualized and normalized for member months. The metric is defined as admissions multiplied by 1000, divided by normalized members:
IP Admits/K = (Total IP Admits * 1000) / (Total MM/12)
Readmission Rate
The Readmission Rate metric shows the percentage of inpatient readmissions for a selected provider compared to other providers during the selected date range. Lower readmission rates are desirable.
To calculate the readmission rate, the number of readmissions is divided by the total number of admissions:
Readmission Rate = Total Readmissions / Total Admissions
The Emergency Department (ED) utilization metric shows the emergency visits for a selected provider's patient panel compared to other providers in the PCP hierarchy during the selected date range. To account for differing panel sizes, the metric uses normalized visit numbers. Lower ED utilization numbers are desirable.
ED Visits/K is the estimated annualized visit value as of the current year-to-date member months (MM). To calculate ED utilization, ED visits are multiplied by 1000 and then divided by normalized members:
ED Visits/K = (Total ED Visits * 1000) / (Total MM/12)
The Quality Metrics card displays the ratio of completed-to-incomplete quality measures for each quality management program your organization is enrolled in. A quality status is considered complete when the upper goal for the measure is met.
Note: The quality metrics shown on the PCP Performance Dashboard are the same quality metrics displayed on the Quality Manager page.
Display the PCP Performance Dashboard as follows: On the Main Menu, click Reports. Under POPULATION MANAGEMENT, click PCP Performance Dashboard.
After you select a PCP, the dashboard view appears. The dashboard provides high-level metrics for the following:
- PMPM (per member per month)
- Inpatient utilization
- Readmissions
- ED utilization
- Quality
Note: If you see a blank screen or an "Insufficient data to display" message, it means that insufficient data is available to populate the card. You can adjust the date range using the Begin Date and End Date filters at the top of the page.
The PCP Performance Dashboard includes a banner, a navigation pane, a performance dashboard, and four detail cards.
The banner at the top of the PCP Performance Dashboard indicates the level of PCP, as well as the PCP name and NPI number.

The level of PCP is indicated with an icon to the left of the provider's name and is determined by the selection made in the PCP filter.
- Level 1 — Network tier (depicted as a hospital building) indicates the highest level in the hierarchy.

- Level 2 — Practice or group tier (depicted as a group of physicians) indicates the second level in the hierarchy.

- Level 3 — Individual provider (depicted as a single physician) indicates the third level in the hierarchy.

You can use the navigation pane on the left side of the PCP Performance Dashboard to display the detail page for each PCP performance metric.
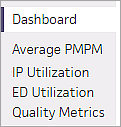
Click Dashboard to return to the PCP Performance Dashboard.
On the dashboard view of the PCP Performance Dashboard, all metrics appear within a "card." Each card represents the performance of the selected PCP. Click a card to display the Detail view.
Note: In the Detail view, click the information icon ![]() to the right of the metric name to display the definition of the metric.
to the right of the metric name to display the definition of the metric.
The Average PMPM card shows the per member per month (PMPM) and the adjusted PMPM for the selected PCP's patient panel compared to the average PMPM of the network.
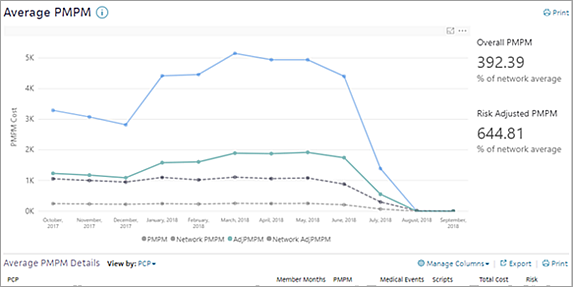
Solid lines indicate the data for the selected PCP. Dashed lines show the network data.
To the right of the graph, the Overall PMPM and Risk Adjusted PMPM for the selected PCP are listed as a percentage of the network average. A percentage smaller than 100% means that the PMPM of the selected PCP is lower than the network PMPM.
Below the graph is a table where you can view the PMPM data by patient (the default view), PCP, reporting category, or payer.
The Inpatient (IP) Utilization card contains two graphs that show:
- Number of inpatient admissions for patients attributed to the selected PCP
- Number of readmissions for patients attributed to the selected PCP
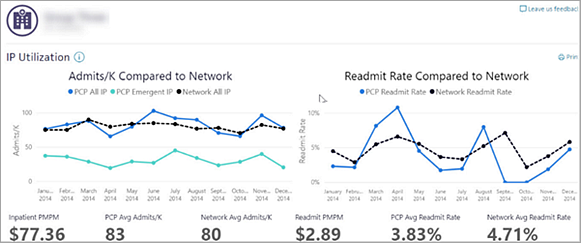
Admits/K graph — Shows inpatient admissions for the selected provider in blue, the admissions that originated via an emergency room visit in aqua, and the network average admissions in black.
Readmit Rate graph — Shows readmissions for the selected provider in blue and the network average in black.
Below the graph is a table where you can view the IP utilization data by facility (the default view), PCP, or patient.
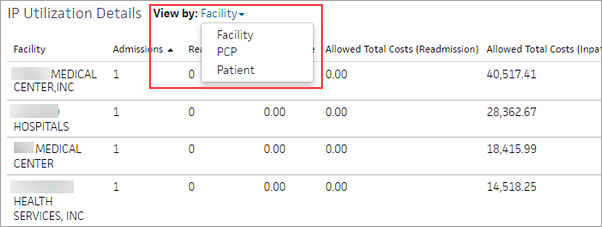
The table displays metrics depending on the View by filter you select.
Note: Emergent IP refers to admissions that originated as emergency department visits.
The ED Utilization card shows a detailed view of the emergency department visit rate for the selected PCP's patient panel compared to the visit rate for the rest of the network.
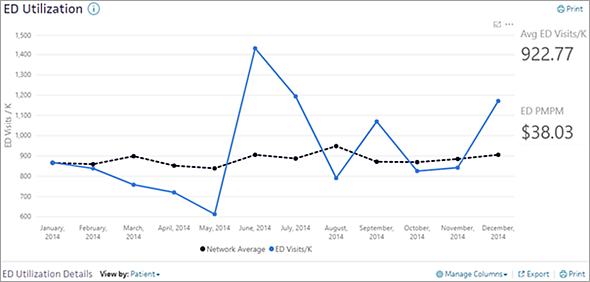
Below the graph is a table where you can view the emergency room visit data by patient (the default view) or by PCP.

The Quality Metrics card displays the ratio of completed-to-incomplete quality measures for each quality management program your organization is enrolled in. These metrics help you gauge the PCP's progress in meeting the goals of their quality programs.
Note: The quality metrics shown on the PCP Performance Dashboard are the same quality metrics displayed on the Quality Manager page.

A quality status is considered complete when the upper goal for the measure is met.
The provider hierarchy groups PCPs together into tiers (Level 1, Level 2, and Level 3) based on your organization's structure. athenaOne uses the provider hierarchy to enhance reporting and data access user permissions in organizations that use athenahealth Population Health. You can see a PCP's standing in the provider hierarchy in the Performance Dashboard banner.
- A single provider can only be included in a single practice.
- A single practice can only be included in a single group.
- Provider NPIs are required. Practice NPIs or TINs are not required.
- Providers represented in the provider hierarchy are considered in-network, based on their start and end dates.
To update the information available in your provider or affiliation hierarchy, you can log in to the sFTP at acesftp.athenahealth.com and submit an updated template to the DROPOFF > PUBLISH_CONTENT_UPDATES folder. If you don't have login access to the sFTP, contact your CSM for more information.
Template naming conventions:
Provider
- CLIENTNAME_PROVIDER_FULLREFRESH_YYYYMMDD.xlsx
- CLIENTNAME_PROVIDER_INCREMENTAL_YYYYMMDD.xlsx
Affiliation
- CLIENTNAME_AFFILIATION_FULLREFRESH_YYYYMMDD.xlsx
- CLIENTNAME_AFFILIATION_INCREMENTAL_YYYYMMDD.xlsx
Note: All updates are due by the 15th of the month, and the updates will become visible in the PCP Performance Dashboard on the third Monday of the following month.