Report List (Population Management Report Library)
athenahealth Population Health
The Report List offers an extensive variety of customizable reports. You can sort, filter, and analyze your data across dimensions, including Financial, Membership, Quality, and Pharmacy. These reports help you to:
- Understand costs and total medical expenses
- Reduce out-of-network utilization
- Identify opportunities for utilization reduction
- Support chronic care and disease management
-
Identify which patients are at risk for developing a medical issue
On the Main Menu, click Reports. Under POPULATION MANAGEMENT, click Report List
Your organization must have the athenahealth Population Health service.
You must have the permission for the specific report you want to view in the form:
{Report Category: Report Name}.
The Report List categorizes reports and displays these categories alphabetically on the left side of the page. Click a category to display the category list in the center pane.
athenahealth offers a variety of reporting packages that you can use to see an overview of your information. These ready-made reports are populated with your data; you can use these reports as-is or use filters to create the views you need.
Note: These reports are available to all athenahealth Population Health users but are primarily designed for users with unrestricted data access (UDA). If you are an RDA user, the data that is displayed in the report is restricted to the PCPs or providers that the RDA users have access to. If you are not sure whether your access credentials are UDA or RDA, contact your system administrator.
See the Resource Overview: Population Health Reporting Package article on the Success Community for:
- Strategy guides for instructions on how to use each of these reports
- Data reference guides for technical documentation. For example, analysts can see how metrics are calculated
Display the Report List: On the Main Menu, click Reports. Under POPULATION MANAGEMENT, click Report List. Click Dashboards on the left side of the page to see the list of available reporting dashboards.
The ADT (Admission, Discharge, Transfer) Overview reporting package helps leaders in value-based care understand the volume and main drivers of ADT events, as well as the efficacy of actions their organization is taking in response to the events.
Refreshed nightly, the ADT Overview reporting package:
- Helps you understand month-over-month volume of ADT events and patient involved in those events
- Shows drivers of ADT events: both event types and patient panels
- Provides a high-level understanding of the patient risk panel
- Stratifies the patient panel by:
- Provider hierarchy
- Servicing facility
- MARA risk band (that is, grouping patients by their MARA score)
- ADT diagnosis
- Filters by care enrollment status (by the program the patient is enrolled in) and event type in addition to the standard report filters
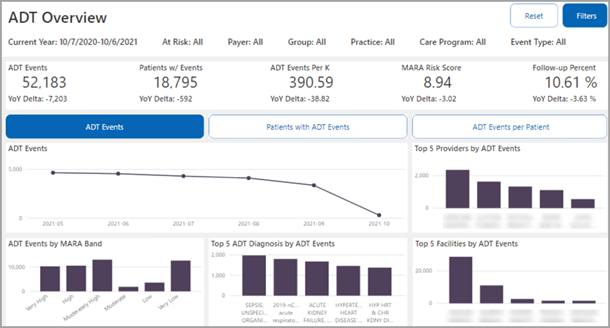
Click one of the following buttons near the upper half of the dashboard:
- ADT Events
- Patients with ADT Events
- ADT Events per Patient
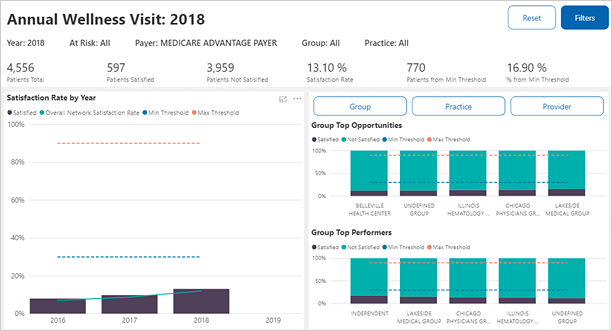
The Annual Wellness Visit reporting package is designed to assist ACOs to succeed under value-based contracts (such as MSSP, Medicare Advantage, etc.) by showing the current status and trending of the AWV quality measure. AWV quality measure satisfaction is highly correlated with satisfaction of other quality measures and can improve patient engagement, RAF gap coding, and practice revenue.
Using this report enables organizations to:
- Track quality performance
- Create targeted patient work lists based on multiple factors
- Identify areas of greatest opportunity
- Inform provider/practice/network coaching decisions
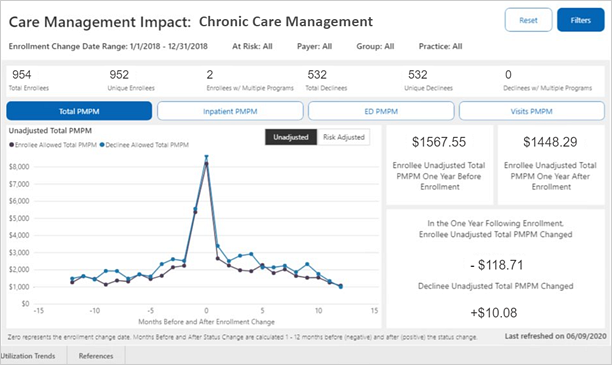
The Care Management Impact Trends reporting package:
- Displays monthly trends of patients enrolled in care management at your organization
- Tracks total costs, cost drivers, and high-risk events before and after patients are enrolled in care management
- Compares trends of patients enrolled in care management to patients who declined to enroll
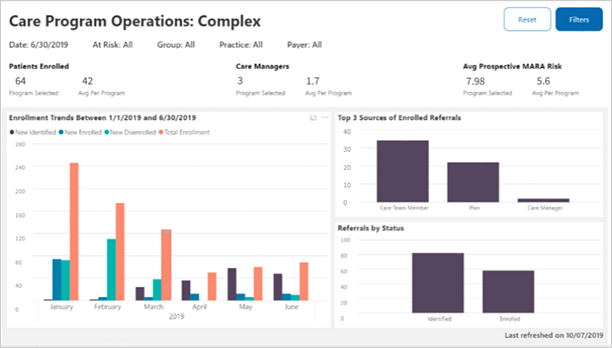
The Care Management Program Operations dashboard equips you to analyze program pathways and track enrollment trends.
You can switch tabs on the bottom of the report. The Care Referral Overview tab helps you make resourcing decisions across care programs and care managers, and the Care Program Operations tab lets you review the performance of a care management program over the past 12 months.
Note: MARA risk scores are calculated on a three-month lag since it takes about three months for a completed procedure to be accounted for in this calculation. The most recent MARA risk score appears in the Risk Score field.
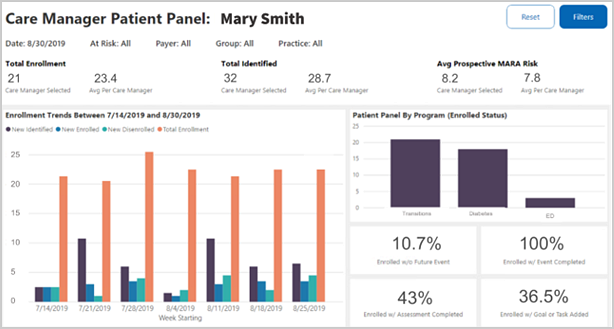
Use the Care Manager Operations dashboard to review care manager workload and identify coaching opportunities for increased productivity and patient engagement.
Note: MARA risk scores are calculated on a three-month lag since it takes about three months for a completed procedure to be accounted for in this calculation. The most recent MARA risk score appears in the Risk Score field.
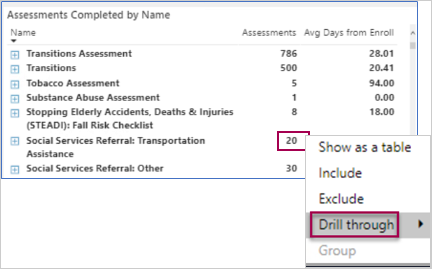
Tip: Right-click on a number in the Assessments Completed by Name section and then select Drill through to see which patients had the assessments along with details (such as provider name, referral status, and more). (Patient information only displays for patients currently enrolled in care management.)
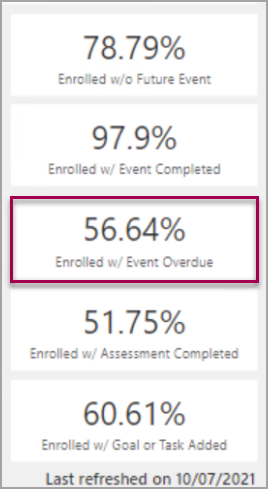
See how many patients have overdue events
On the right side of the report, you can see the percentage of enrolled patients with overdue events.
The COVID-19 Population Insights reporting package identifies practices with highest rate of confirmed COVID-19 patients and at-risk patient populations (patients at risk for more severe illness), helps your organization understand the patient population's COVID-19 related exposure and risk, and provides patient lists to support patient care during the pandemic.
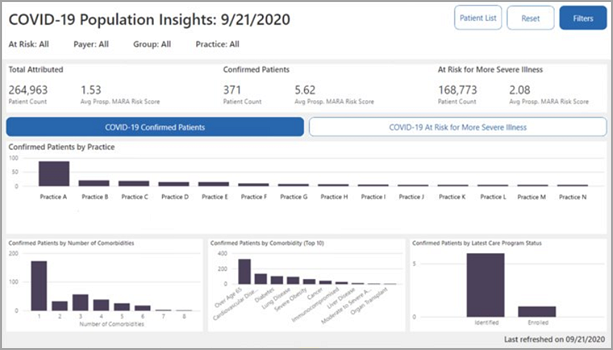
To identify the population of patients at a higher risk for a severe case of COVID-19, athenahealth uses MARA clinical classifications and SNOMED codes mapped to the following conditions and other risk factors (based on the May 2020 CDC guidelines):
- Asthma
- Chronic kidney disease being treated with dialysis
- Chronic lung disease
- Diabetes
- Immunocompromised
- Liver disease of people aged 65 years and older
- Serious heart conditions
- Severe obesity
| Code Set | Code | Description |
| SNOMED | 840533007 | Severe acute respiratory syndrome coronavirus 2 (organism) |
| SNOMED | 840539006 | Disease caused by severe acute respiratory syndrome coronavirus 2 (disorder) |
| ICD-10 | U07.1 | COVID-19 |
See Resource Overview: Population Health Reporting Package on the Success Community for more information, including strategy guides and data reference guides.
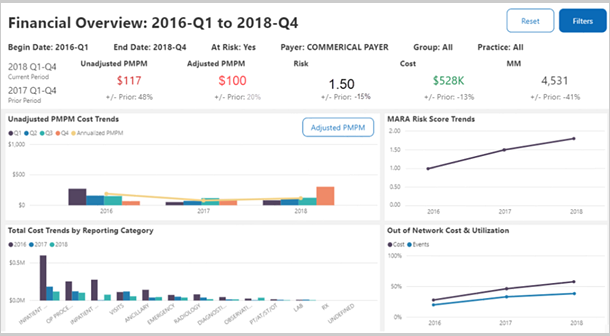
The Financial Overview provides high-level, multi-year trending views of key financial metrics, offering a broad, more holistic view of the organization's financial landscape and performance. This report helps "tell the story" of how the organization is currently performing compared to prior periods, highlighting areas of progress and identifying opportunities for further investigation or improvement.
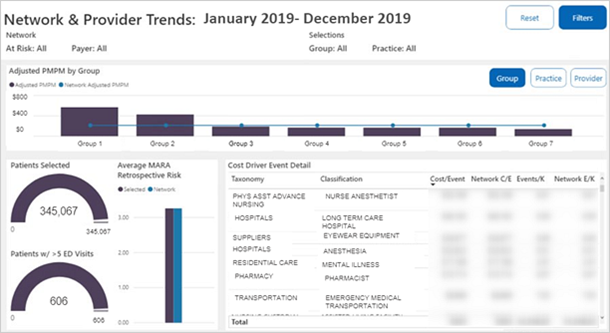
The Financial Provider and Network Cost Drivers reporting package:
- Identifies providers with high PMPM (high cost providers, groups, or practices in your network)
- Identifies the services that are driving those costs up (such as residential treatment)
- Compares high cost practice trends to network benchmarks
The HCC Overview reporting package:
-
Provides a high-level understanding of the patient risk panel
-
Stratifies the patient panel by:
-
Diagnosis gap type
-
Provider hierarchy
-
Care enrollment status
-
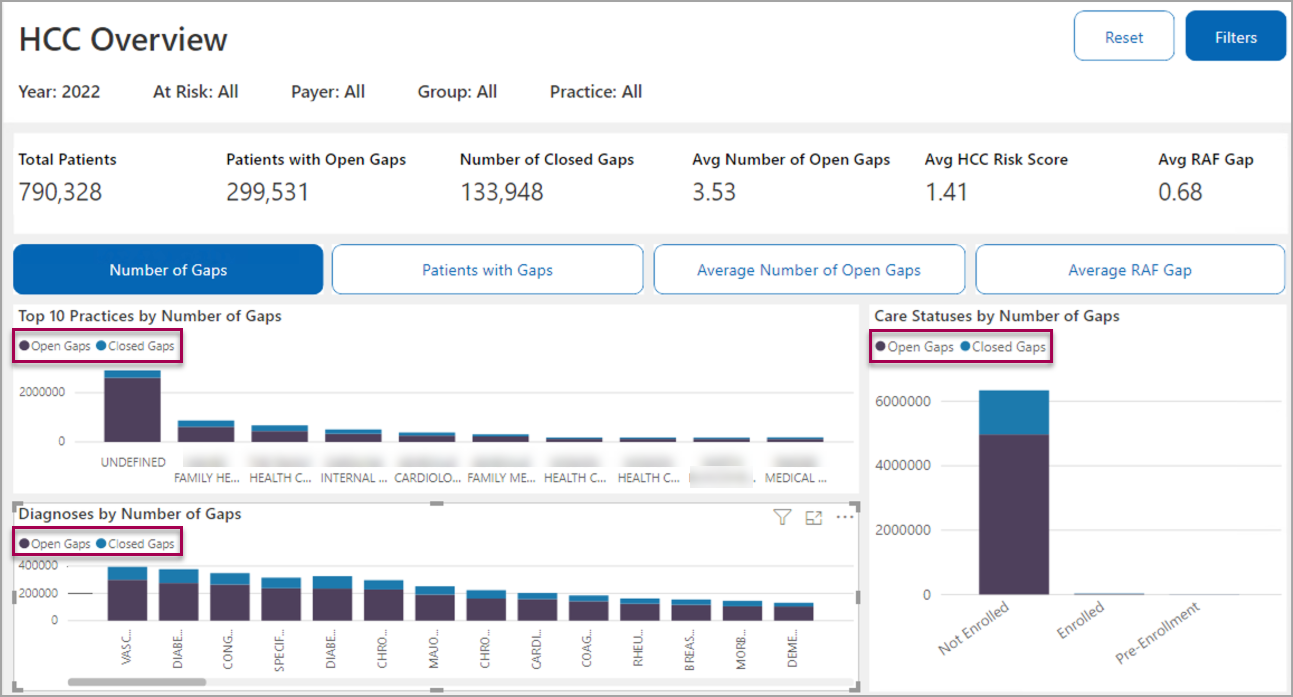
Tip: Click one of the buttons (Number of Gaps, Patients with Gaps, Average Number of Open Gaps, or Average RAF Gap.) to switch the visual metrics. The visuals show a breakdown of what percentage of the gaps are still open (purple bars) and what percent are closed (blue bars).
The first button is clicked in the example shown above; however, click Average Number of Open Gaps to view the top 10 practices by average number of open gaps, diagnoses by average number of open gaps, and care status by average number of open gaps.
The Social Determinants of Health (SDoH) Insights reporting package helps Population Health leaders, practice managers, and analysts better understand how community level risk factors affect the communities your patients live in. It incorporates social determinants of health data from the United States Census Bureau and combines it with your population health data based on patient zip codes. With this report, you can easily visualize which practices might be servicing the most high-risk patient populations and see real time examples of how SDoH risk factors are correlated to clinical health outcomes.
COVID-19 Note: The Health Outcome Selection section of the Social Determinants of Health Insights reporting package shows you the percentage of patients in a practice that are infected with COVID-19, which lets you see how your organization's SDoH Factor Rating compares to the % of your patient panel with COVID-19.
The VBC Performance Insights reporting package offers a snapshot of your organization's performance across the following domains:
-
Membership
-
Cost and utilization
-
Quality
-
Care
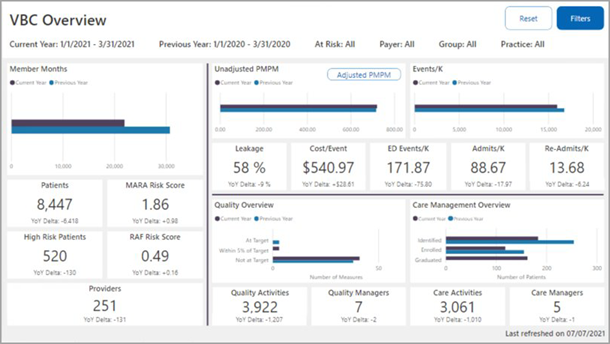
Note: The VBC Performance Insights report is only visible to users with unrestricted data access (UDA).
Admin reports track the use of the Population Management application.
The Report List offers one administrative report called the Application Use report.
You must have the Population Management: GridViewer - Application Use permission to access this report.
The Application Use report displays the number of unique logins by users, usually administrators, for a specified time range and calculates the average session length (in minutes) for each user.
If you use the Care Manager feature, the report also displays the number of care teams that the user is assigned to. Optional Care Manager fields include the number of activities completed, activities completed per day, activities created, and activities created per day.
The Application Use report does not display users that have never logged in. Only users with one or more logins appear on this report.
Use Care Management reports to:
- View patients enrolled in care management
- Track complete and incomplete care management activities
Available Care Management reports and the permissions required are listed here:
- Care Activity Detail — You must have the Population Management: GridViewer - Care Activity Detail permission to access this report.
- Care Future Activity Detail — You must have the Population Management: GridViewer - Care Activity Future Detail permission to access this report.
- Care No Future Activity — You must have the Population Management: GridViewer - Care No Future Activity permission to access this report.
- Care Overdue Activity Detail — You must have the Population Management: GridViewer - Care Overdue Activity permission to access this report.
- Care Referral Detail — You must have the Population Management: GridViewer - Care Referral Detail permission to access this report.
- Care Status Detail — You must have the Population Management: GridViewer - Care Status Detail permission to access this report.
The Care Management activity detail reports include:
- The Care Activity Detail report displays all completed and scheduled care manager activities for all members in Care Management. The Duration (mins) column displays the time (in minutes) that a care manager, or other end user, spends with a patient on care events (also referred to as tasks or activities), such as phone calls, consultations, or documentation. This report helps ensure that operational leaders can report on time spent by their staff.
- The Care No Future Activity Detail report displays all active Care Management patients who do not have any future Care Management tasks scheduled. This report helps identify records that need intervention or possible discharge from the Care Manager.
- The Care Future Activity Detail report displays all scheduled Care Manager activities for all members active in Care Management.
- The Care Overdue Activity Detail report displays all active Care Management patients with activities that are overdue.
ED reports allow you to:
- View trends and costs of emergency room visits
- Track frequent emergency room visitors
Available ED reports and the permissions required are listed here:
- ED Annual Trend by Facility — You must have the Population Management: ReportViewer - ED Annual Trend by Facility permission to access this report.
- ED Annual Trend by PCP — You must have the Population Management: ReportViewer - ED Annual Trend by Facility permission to access this report.
- ED Annual Trend by Procedure — You must have the Population Management: ReportViewer - ED Annual Trend by Procedure permission to access this report.
- ED Detail — You must have the Population Management: ReportViewer - ED Detail permission to access this report.
- ED Frequent Utilization — You must have the Population Management: GridViewer - ED Frequent Utilization Report permission to access this report.
- ED Peer Comparison by Facility — You must have the Population Management: ReportViewer - ED Peer Comparison by Facility permission to access this report.
- ED Quarterly Trend by Facility — You must have the Population Management: ReportViewer - ED Quarterly Trend by Facility permission to access this report.
- ED Top Affiliation — You must have the Population Management: GridViewer - ED Top Affiliation permission to access this report.
- ED Top Diagnosis — You must have the Population Management: GridViewer - ED Top Diagnosis permission to access this report.
View Financial reports to:
- Visualize utilization by facility and PCP
- Track PMPM and other cost metrics
- Identify utilization by network and competitor facilities
Available Financial reports and the permissions required are listed here:
- Efficiency Annual Trend — You must have the Population Management: ReportViewer - Efficiency Annual Trend permission to access this report.
- Financial Settlement — You must have the Population Management: Dashboard - Financial Settlement permission to access this report.
- Financial Top PCP — You must have the Population Management: GridViewer - Financial Top PCP permission to access this report.
- Financial Top Provider — You must have the Population Management: GridViewer - Financial Top Provider permission to access this report.
- Network Utilization — You must have the Population Management: Dashboard - Network Utilization permission to access this report.
- Quarterly Efficiency Trend - PMPM — You must have the Population Management: ReportViewer - Quarterly Efficiency Trend permission to access this report.
- Quarterly Efficiency Trend - Utilization — You must have the Population Management: ReportViewer - Quarterly Efficiency Trend - Utilization permission to access this report.
- Utilization Overview — You must have the Population Management: Dashboard - Utilization Overview permission to access this report.
The Efficiency Annual Trend report:
- Compares the current year's cost and utilization by service category
- Calculates the percentage increase or decrease
The Paid Date filter for both the Efficiency Annual Trend report and the Financial Settlement report use the claim run-out period used for other analyses. Thus, you can make accurate comparisons of year-over-year trends.
- Display the Report List: On the Main Menu, click Reports. Under POPULATION MANAGEMENT, click Report List.
- Select Financial from the menu on the left.
- Select Efficiency Annual Trend.
- Click the Add Filter icon
 to add a filter, and then select PAID DATE.
The PAID DATE box appears. - Select a month for the paid date, and then click Apply.
The Paid Date filter for both the Efficiency Annual Trend report and the Financial Settlement report use the claim run-out period used for other analyses. Thus, you can make accurate comparisons of year-over-year trends.
- Display the Report List: On the Main Menu, click Reports. Under POPULATION MANAGEMENT, click Report List.
- Select Financial from the menu on the left.
- Select Financial Settlement.
- Click the Add Filter icon
 to add a filter, and then select PAID DATE.
The PAID DATE box appears. - Select a month for the paid date, and then click Apply.
The Network Utilization report displays year-to-date PMPM cost for network providers versus competitors by reporting category. You can also access additional information about each reporting category.
- Display the Report List: On the Main Menu, click Reports. Under POPULATION MANAGEMENT, click Report List.
- Select Financial from the menu on the left.
- Select Network Utilization.
- Click any PMPM or event count for a detailed list of events. For example, in the COMPETITOR column, click the dollar amount for Inpatient Acute PMPM to display a detailed list of events.
- Click any events or costs to view further details.
The affiliation hierarchy categorizes providers and organizations into in-network and out-of-network groups. You can use the affiliation hierarchy to gain insight into cost trends in your organization, which allows you to analyze where money is going. You can see your affiliation hierarchy in the Network Utilization report.
Note: If you don't see a structure that suits your needs, you can contact your CSM to help you create a new hierarchy view (for example, a Preferred Out-of-Network structure) based on your organization's goals.
An in-network structure lets you see who works for your organization and where care is being performed.
- Level 1 — In-network
- Level 2 — Network facilities and/or network providers
- Level 3 — Facility NPIs and/or Provider NPIs
An out-of-network, or competitor, structure lets you identify into network gaps that your organization and highlights areas of opportunity for reducing those gaps.
- Level 1 — Competitors
- Level 2 — Non-network providers
- Level 3 — Provider NPIs
An out-of-area structure lets you see network gaps that your organization may not be able to reduce. The default logic for this structure shows NPIs that are located out of state.
- Level 1 — Other
- Level 2 — Out-of-area or other
- Level 3 — Out-of-state NPIs and/or NPIs not found elsewhere
- A single NPI (provider or facility) can only be included in a single affiliation category at a single point in time.
- The default system logic automatically groups all NPIs represented in the provider hierarchy into the Network Physicians affiliation category.
To update the information available in your provider or affiliation hierarchy, you can log in to the sFTP at acesftp.athenahealth.com and submit an updated template to the DROPOFF > PUBLISH_CONTENT_UPDATES folder. If you don't have login access to the sFTP, contact your CSM for more information.
Template naming conventions:
Provider
- CLIENTNAME_PROVIDER_FULLREFRESH_YYYYMMDD.xlsx
- CLIENTNAME_PROVIDER_INCREMENTAL_YYYYMMDD.xlsx
Affiliation
- CLIENTNAME_AFFILIATION_FULLREFRESH_YYYYMMDD.xlsx
- CLIENTNAME_AFFILIATION_INCREMENTAL_YYYYMMDD.xlsx
Note: All updates are due by the 15th of the month, and the updates will become visible in the PCP Performance Dashboard on the third Monday of the following month.
Inpatient reports allow you to:
- See which diagnoses contribute to highest inpatient costs
- Track which facilities have the highest admission rates
Available Inpatient reports and the permissions required are listed here:
- ADT Detail — You must have the Population Management: GridViewer - ADT Detail permission to access this report.
- Daily Census — You must have the Population Management: GridViewer - Daily Census permission to access this report.
- Inpatient Annual Trend by DRG — You must have the Population Management: ReportViewer - Inpatient Annual Trend by DRG permission to access this report.
- Inpatient Annual Trend by Facility — You must have the Population Management: ReportViewer - Inpatient Annual Trend by Facility permission to access this report.
- Inpatient Annual Trend by PCP — You must have the Population Management: ReportViewer - Inpatient Annual Trend by PCP permission to access this report.
- Inpatient by DRG — You must have the Population Management: PathDetailViewer - Inpatient by DRG permission to access this report.
- Inpatient Detail — You must have the Population Management: GridViewer - Inpatient Detail permission to access this report.
- Inpatient Peer Comparison by DRG — You must have the Population Management: ReportViewer - Inpatient Peer Comparison by DRG permission to access this report.
- Inpatient Quarterly Network Utilization Trend by Facility - Admits — You must have the Population Management: ReportViewer - Inpatient Quarterly Network Utilization Trend by Facility - Admits permission to access this report.
- Inpatient Quarterly Network Utilization Trend by Facility - PMPM — You must have the Population Management: ReportViewer - Inpatient Quarterly Network Utilization Trend by Facility - PMPM permission to access this report.
- Inpatient Quarterly Trend by Facility - Events — You must have the Population Management: ReportViewer - Inpatient Quarterly Trend by Facility - Events permission to access this report.
- Inpatient Quarterly Trend by Facility - Events/K — You must have the Population Management: ReportViewer - Inpatient Quarterly Trend by Facility - Events/K permission to access this report.
- Inpatient Quarterly Trend by Facility - PMPM
Displays quarterly trend in inpatient leakage for each facility by number of events. - Inpatient Top Affiliation — You must have the Population Management: GridViewer - Inpatient Top Affiliation permission to access this report.
- Inpatient Top DRG — You must have the Population Management: GridViewer - Inpatient Top DRG permission to access this report.
- Inpatient Top Physicians — You must have the Population Management: GridViewer - Inpatient Top Physicians permission to access this report.
- Inpatient Utilization — You must have the Population Management: Dashboard - Inpatient Utilization permission to access this report.
The Inpatient Detail report provides a detailed view of each patient admission including:
- Admit date
- Primary provider
- Facility
- Cost
You can add the ICD Version column to distinguish between ICD-9 and ICD-10 diagnosis codes.
- Display the Report List: On the Main Menu, click Reports. Under POPULATION MANAGEMENT, click Report List.
- Select Inpatient from the menu on the left.
- Select Inpatient Detail.
- Click the Field Chooser icon
 .
. - Click the ICD Version field and drag it to the place in the report where you want the column to appear.
Depending on the diagnosis code version, rows in this column display either ICD9 or ICD10.
Member reports track the patients covered by your quality contracts.
Available Member reports and the permissions required are listed here:
- Member List — You must have the Population Management: GridViewer - Member List permission to access this report.
- Member Panel — You must have the Population Management: Dashboard - Member Panel permission to access this report.
- Member Risk — You must have the Population Management: Dashboard - Member Risk permission to access this report.
- Membership by Month — You must have the Population Management: GridViewer - Membership by Month permission to access this report.
- Membership by Payor — You must have the Population Management: GridViewer - Membership by Payor permission to access this report.
The Member Panel report summarizes:
- Panel size, that is, patients per health plan, for the current and prior month as well as for the current and prior year to date
- Rolling 12-month panel size by health plan
- Membership by PCP with summary statistics for each PCP
You can view which PCPs have higher per-member per-month (PMPM) costs in your organization.
Scroll down to find the Membership Overview by PCP: Current Year to Date chart and sort it by risk-adjusted PMPM cost (click the Adj. PMPM column header to sort the data by risk-adjusted PMPM in descending order). Click again to sort in ascending order.
You can target potential cost reduction interventions to providers whose PMPM is above the network's average PMPM cost.
The Member Risk report summarizes
- Average risk score by health plan
- PMPM expense by risk class by health plan
- Top members by risk score with financial details
Use the population filter to view and sort the Member Risk report by population. For example, you can see lists of your patients by disease types, High Cost (100k), High Cost (50k), New Payor, New PCP, and No PCP Visits.
- Display the Report List: On the Main Menu, click Reports. Under POPULATION MANAGEMENT, click Report List.
- Select Member from the menu on the left.
- Select Member Risk.
- Click the Add Filter icon
 and select Population.
 - Select the population of interest and click Apply.
With Outpatient reports, you can:
- Track trends of outpatient visits by procedure, cost, and facility
- View the most common outpatient procedures by facility and PCP
Available Outpatient reports and the permissions required are listed here:
- Outpatient Annual Trend by Facility — You must have the Population Management: ReportViewer - Outpatient Annual Trend by Facility permission to access this report.
- Outpatient Annual Trend by PCP — You must have the Population Management: ReportViewer - Outpatient Annual Trend by PCP permission to access this report.
- Outpatient by Procedure — You must have the Population Management: PathDetailViewer - Outpatient by Procedure permission to access this report.
- Outpatient Detail — You must have the Population Management: GridViewer - Outpatient Detail permission to access this report.
- Outpatient Peer Comparison by Procedure — You must have the Population Management: ReportViewer - Outpatient Peer Comparison by Procedure permission to access this report.
- Outpatient Quarterly Trend by Provider - Cases — You must have the Population Management: ReportViewer - Outpatient Quarterly Trend by Provider - Cases permission to access this report.
- Outpatient Quarterly Trend by Provider - Cases/K — You must have the Population Management: ReportViewer - Outpatient Quarterly Trend by Provider - Cases/K permission to access this report.
- Outpatient Quarterly Trend by Provider - PMPM — You must have the Population Management: ReportViewer - Outpatient Quarterly Trend by Provider - PMPM permission to access this report.
- Outpatient Top Affiliation — You must have the Population Management: GridViewer - Outpatient Top Affiliation permission to access this report.
- Outpatient Top Procedure — You must have the Population Management: GridViewer - Outpatient Top Procedure permission to access this report.
- Readmission Risk — You must have the Population Management: GridViewer - Readmission Risk permission to access this report.
With Quality reports, you can:
- Track instances of preventive screenings for patients
- View compliance and progress for quality programs
Many of these reports provide an optional "Is Excluded" filter to more accurately see your compliance rate for a quality measure after filtering out patients who should be excluded from the measure before running the report.
Tip: To ease communication with patients, use the Field Chooser icon ![]() to add Phone Number and Address fields to Quality Screening and History reports.
to add Phone Number and Address fields to Quality Screening and History reports.
Available Quality reports and the permissions required are listed here:
- Mean Hypertensives vs. BP Outcomes — You must have the Population Management: PathDetailViewer - Mean Hypertensives vs. BP Outcomes permission to access this report.
- Quality Annual Trend — You must have the Population Management: GridViewer - Quality Annual Trend permission to access this report.
- Quality Cancer Screening History — You must have the Population Management: GridViewer - Quality Cancer Screening History permission to access this report.
- Quality Cardiovascular Screening History — You must have the Population Management: GridViewer - Quality Cardiovascular Screening History permission to access this report.
- Quality CMS ACO Scorecard - PCP — You must have the Population Management: GridViewer - Quality CMS ACO Scorecard permission to access this report.
- Quality Compliance - PCP — You must have the Population Management: GridViewer - Quality Compliance - PCP permission to access this report.
- Quality Compliance BCBS AQC - PCP — You must have the Population Management: GridViewer - Quality Compliance BCBS AQC - PCP permission to access this report.
- Quality Diabetic Event History — You must have the Population Management: GridViewer - Quality Diabetic Event History permission to access this report.
- Quality Hypertensive Screening History — You must have the Population Management: GridViewer - Quality Hypertensive Screening History permission to access this report.
- Quality Measure Compliance by PCP — You must have the Population Management: GridViewer - Quality Measure Compliance by PCP permission to access this report.
- Quality Measure Detail — You must have the Population Management: GridViewer - Quality Measure Detail permission to access this report.
- Quality Measure Summary — You must have the Population Management: GridViewer - Quality Measure Summary permission to access this report.
- Quality Person Compliance — You must have the Population Management: GridViewer - Quality Person Compliance permission to access this report.
- Quality Plan Non-Compliant — You must have the Population Management: GridViewer - Quality Plan Non-Compliant permission to access this report.
- Quality Plan vs. Actual Compliance — You must have the Population Management: GridViewer - Quality Plan vs. Actual Compliance permission to access this report.
- Quality Plan vs. Registry — You must have the Population Management: ReportViewer - Quality Plan vs. Registry permission to access this report.
- Quality Process and Outcomes — You must have the Population Management: ReportViewer - Quality Process and Outcomes permission to access this report.
- Quality Provider Comparison — You must have the Population Management: ReportViewer - Quality Provider Comparison permission to access this report.
- Quality Scorecard — You must have the Population Management: GridViewer - Quality Scorecard permission to access this report.
-
Quality Test Medication — You must have the Population Management: ReportViewer - Quality Test Medication permission to access this report.
- Quality Well Child Visit History — You must have the Population Management: GridViewer - Quality Well Child Visit History permission to access this report.
- Statins PMPM and Diabetic LDL Compliance — You must have the Population Management: PathDetailViewer - Statins PMPM and diabetic LDL Compliance permission to access this report.
- Display the Report List: On the Main Menu, click Reports. Under POPULATION MANAGEMENT, click Report List.
- Click Quality in the menu on the left.
- Click the quality report of interest.
Note: This filter is available only for the following reports:- Quality Annual Trend
- Quality Cancer Screening History
- Quality Cardiovascular Screening History
- Quality Compliance BCBS AQC - PCP
- Quality Diabetic Event History
- Quality Hypertension Screening History
- Quality Measure Compliance by PCP
- Quality Measure Detail
- Quality Measure Summary
- Quality Person Compliance
- Quality Process and Outcomes
- Quality Provider Comparison
- Quality Scorecard
- Quality Well Child Visit History
- Click the Add Filter icon
 .
. - Select "Is Excluded."
- Select an option:
- Invalid
- No
- Yes
- Click Apply.
Compile a Quality Measure Compliance by PCP report to view how your practice performs on all quality measures it participates in. The report is comparable to the Quality BCBS AQC Scorecard - PCP report, but it is available for non-BCBS providers. It includes your entire patient population, and the information lets you review your performance in real time.
The report helps you assess the quality of care that PCPs in your organization provide to patients, regardless of the payer or claim status. You can export the report data to Excel to incorporate it in custom reports.
- Display the Report List: On the Main Menu, click Reports. Under POPULATION MANAGEMENT, click Report List.
- Click Quality in the menu on the left.
- Click Quality Measure Compliance by PCP.
Note: You can open the report with or without pre-filters. Click the Filter icon to open with pre-filters; click the name of the report to open without pre-filters. - Add filters, and then click Apply. To add filters, do one of the following:
- Click the Add Filter icon
 and then select a filter.
 - Click Show filters (in the upper right corner).
- To export report data to Excel, click the download icon in the upper right corner of the report.
Note: To show each PCP's compliance with the Blue Cross Blue Shield of Massachusetts Alternative Quality Contract (AQC) measures within your organization, run the Quality Compliance BCBS AQC - PCP report.
Radiology reports allow you to view trends and costs of radiology procedures.
Available Radiology reports and the permissions required are listed here:
- Radiology Annual Trend by Facility — You must have the Population Management: ReportViewer - Radiology Annual Trend by Facility permission to access this report.
- Radiology Annual Trend by PCP — You must have the Population Management: ReportViewer - Radiology Annual Trend by PCP permission to access this report.
- Radiology Annual Trend by Procedure — You must have the Population Management: ReportViewer - Radiology Annual Trend by Procedure permission to access this report.
-
Radiology by Procedure — You must have the Population Management: PathDetailViewer - Radiology by Procedure permission to access this report.
- Radiology Detail — You must have the Population Management: GridViewer - Radiology Detail permission to access this report.
- Radiology Peer Comparison by Procedure — You must have the Population Management: ReportViewer - Radiology Peer Comparison by Procedure permission to access this report.
- Radiology Quarterly Trend by Procedure — You must have the Population Management: ReportViewer - Radiology Quarterly Trend by Procedure permission to access this report.
- Radiology Quarterly Trend by Procedure - Events — You must have the Population Management: ReportViewer - Radiology Quarterly Trend by Procedure - Events permission to access this report.
- Radiology Quarterly Trend by Provider — You must have the Population Management: ReportViewer - Radiology Quarterly Trend by Provider permission to access this report.
- Radiology Quarterly Trend by Provider - Events — You must have the Population Management: ReportViewer - Radiology Quarterly Trend by Provider - Events permission to access this report.
- Radiology Quarterly Trend by Provider - Events/K — You must have the Population Management: ReportViewer - Radiology Quarterly Trend by Provider - Events/K permission to access this report.
- Radiology Quarterly Trend by Provider - PMPM — You must have the Population Management: ReportViewer - Radiology Quarterly Trend by Provider - PMPM permission to access this report.
- Radiology Top Affiliation — You must have the Population Management: GridViewer - Radiology Top Affiliation permission to access this report.
- Radiology Top Procedure — You must have the Population Management: GridViewer - Radiology Top Procedure permission to access this report.
RX (Pharmacy) reports allow you to:
- Track trends and costs of prescriptions used by covered patients
- View which PCPs have the highest PMPM for medication costs
Available RX reports and the permissions required are listed here:
- RX Annual Trend by NDC — You must have the Population Management: ReportViewer - RX Annual Trend by NDC permission to access this report.
- RX Annual Trend by NDC - Volume — You must have the Population Management: ReportViewer - RX Annual Trend by NDC - Volume permission to access this report.
-
RX Annual Trend by PCP — You must have the Population Management: ReportViewer - RX Annual Trend by PCP permission to access this report.
- RX Annual Trend by PCP - Volume — You must have the Population Management: ReportViewer - RX Annual Trend by PCP - Volume permission to access this report.
-
RX Annual Trend by Therapeutic Class — You must have the Population Management: ReportViewer - RX Annual Trend by Therapeutic Class permission to access this report.
-
RX Annual Trend by Therapeutic Class - Volume — You must have the Population Management: ReportViewer - RX Annual Trend by Therapeutic Class - Volume permission to access this report.
- RX by Medication — You must have the Population Management: PathDetailViewer - RX Annual Trend by RX by Medication permission to access this report.
- RX by PCP — You must have the Population Management: PathDetailViewer - RX Annual Trend by RX by PCP permission to access this report.
- RX Detail — You must have the Population Management: GridViewer - RX Annual Trend by RX Detail permission to access this report.
- RX Multiple Prescribers — You must have the Population Management: GridViewer - RX Multiple Prescribers permission to access this report.
- RX Overview — You must have the Population Management: Dashboard - RX Annual Trend by RX Overview permission to access this report.
- RX Peer Comparison by Therapeutic Class — You must have the Population Management: ReportViewer - RX Peer Comparison by Therapeutic Class permission to access this report.
- RX Peer Comparison by Therapeutic Class - Volume — You must have the Population Management: ReportViewer -RX Peer Comparison by Therapeutic Class - Volume permission to access this report.
- RX Top Medication — You must have the Population Management: GridViewer - RX Top Medication permission to access this report.
- RX Top Medications — You must have the Population Management: ReportViewer - RX Top Medications permission to access this report.
- RX Top PCP — You must have the Population Management: GridViewer - RX Top PCP permission to access this report.
- RX Top PCPs — You must have the Population Management: ReportViewer - RX Top PCPs permission to access this report.
- RX Top Prescriber — You must have the Population Management: GridViewer - RX Top Prescriber permission to access this report.
- RX Top Prescribers — You must have the Population Management: ReportViewer - RX Top Prescribers permission to access this report.
Severity reports allow you to:
- Track severity scores by PCPs and members
- Identify clinical drivers of severity scores
Available Severity reports and the permissions required are listed here:
- Severity Detail — You must have the Population Management: GridViewer - Severity Detail permission to access this report.
- Severity Stratification — You must have the Population Management: Dashboard - Severity Stratification permission to access this report.
- Severity Trend — You must have the Population Management: Dashboard - Severity Trend permission to access this report.
- Summary Risk — You must have the Population Management: Dashboard - Summary Risk permission to access this report.
Visit reports track trends in outpatient and specialty visits.
Available Visit reports and the permissions required are listed here:
- OV Annual Trend by PCP — You must have the Population Management: ReportViewer - OV Annual Trend by PCP permission to access this report.
- OV Annual Trend by Specialty — You must have the Population Management: ReportViewer - OV Annual Trend by Specialty permission to access this report.
- OV Peer Comparison by Specialty — You must have the Population Management: ReportViewer - OV Peer Comparison by Specialty permission to access this report.
- Visit Detail — You must have the Population Management: GridViewer - Visit Detail permission to access this report.
You can view procedure codes in the Visit Detail report.
To filter for a procedure code, click the Field Chooser icon ![]() and then click the Sort icon
and then click the Sort icon ![]() next to CPTID. CPTID stands for Current Procedural Terminology ID. Then, select the codes to filter for.
next to CPTID. CPTID stands for Current Procedural Terminology ID. Then, select the codes to filter for.
- Display the Report List: On the Main Menu, click Reports. Under POPULATION MANAGEMENT, click Report List.
- Click Visit in the menu on the left.
- Click Visit Detail.
- Click the Field Chooser
 .
. - Click the Sort icon
 to the right of CPTID.
 - Select the codes to filter for.
When you click a category in the left pane, the list of reports in the selected category appears in the center pane. The reports you see listed may also depend on your user permissions. Click a report name to run the report.
Each report listed in the center of the Report List page presents data in one of four ways. An icon precedes each report name to indicate the layout of the report.
| Formatted Reports |
|
Reports with a static design layout. These reports are often used for board books that need to look the same every month and are often included in board books for management.
Formatted reports include:
|
| Grid Reports |
|
Flexible reports that allow you to customize display columns and data organization.
Grid reports include:
|
| Scatterplot Reports |
|
Reports that visually represent the distribution of discrete units, such as practices and procedures, across two axes.
Scatterplot reports include:
|
| Dashboard Reports |
|
High-level overview reports, with multiple panels of data, that allow you to drill down for additional details.
Dashboard reports include:
|
- Set the filters of a report before it opens and loads.
- Use global filters so that the selected filters remain set. For example, if you set the Reporting Category on one report to be "Emergency," the next report you display will also have the Reporting Category pre-set to "Emergency."
- Add and remove reports from the Report Quick Picks even though this list is populated automatically.
- Print dashboard reports using a Print link.
- Save a report with the filters as a bookmark and return to that same report at a later time.
On the right side of the page, your Report Quick Picks allow easy access to the reports you use most often, as well as any reports that you pinned there.
- Display the Report List: On the Main Menu, click Reports. Under POPULATION MANAGEMENT, click Report List.
- Select Dashboards from the menu on the left and select a dashboard, such as Financial Overview, from the list of dashboards in the center.
- View the report and refer to the Resource Overview: Population Health Reporting Package article on the Success Community for instructions on how to customize the report to meet your organization's needs.
-
Click Filters on the upper right of the dashboard to change the filters.
Note: Reset sets the filter selections back to the defaults. -
Select the desired filter options.
Tip: Click the down arrow to expand a section and select more specific options.
 -
Click Apply.
- Display the Report List: On the Main Menu, click Reports. Under POPULATION MANAGEMENT, click Report List.
- Select the report category from the menu on the left to display reports in that category that you have access to.
- Select the report you want to view from the list in the middle of the page.
- Display the Report List: On the Main Menu, click Reports. Under POPULATION MANAGEMENT, click Report List.
- Select the report category from the menu on the left to display reports in that category that you have access to.
- Click on the Pin icon
 next to the report title.
- Display theReport List: On the Main Menu, click Reports. Under POPULATION MANAGEMENT, click Report List.
- Click on the drop-down arrow next to a report in the Quick Picks list.
- Select Remove from list.
- Display the Report List: On the Main Menu, click Reports. Under POPULATION MANAGEMENT, click Report List.
- Click on the drop-down arrow next to a report in the Quick Picks list.
- Select Unpin from top of list.
- Display the Report List: On the Main Menu, click Reports. Under POPULATION MANAGEMENT, click Report List.
- Select the Filter icon
 next to the report.
 - The report opens, with the filter panel already open at the top of the page.
- Set the desired filters and click Apply.
Grid reports are the most flexible of reports in the Report List. You can add filters, add fields, rearrange and sort columns, and export the report.
- Display the Report List: On the Main Menu, click Reports. Under POPULATION MANAGEMENT, click Report List.
- Select the report type, such as ED.
Note: These instructions work for grid reports. - Select the name of the grid report you want to edit, such as the ED Detail report.
- Customize the report as needed.
- Add a filter.
- Click the Add Filter icon
 and select a filter.
 Make selections based on the filter chosen and click Apply.
- Click the Add Filter icon
- Add a field.
- Click the Field Chooser icon
 at the top right of the report.
 - Click the field you want to add.
Note: Some fields have an additional drop-down list for you to choose from to allow further specificity. - Drag the field to the place in the report where you want the column to appear.
- Click the Field Chooser icon
- Re-sort the report.
- Drag a column header in front of the first column of the report to regroup data by that field.
- Rearrange columns.
- Drag a column header in front of another column of the report to reposition the column.
- Continue to drag column headers as needed.
- Re-sort a column.
- Click on a column header to resort the column.
- Click on the Sort icon
 to sort the column again in ascending or descending order.
- Click the Download icon
 in the upper right corner of the report to download the report to Microsoft Excel.
- Display the Report List: On the Main Menu, click Reports. Under POPULATION MANAGEMENT, click Report List.
- Click the name of the dashboard report that you want to print.
- Click the Add Filters icon
 to add filters, if desired.
 -
Near the upper right of the page, click Print.
- Display the Report List: On the Main Menu, click Reports. Under POPULATION MANAGEMENT, click Report List.
- Click the Severity Detail report.
Notice that "Prospective" appears in all applicable column headings.
- Display the Report List: On the Main Menu, click Reports. Under POPULATION MANAGEMENT, click Report List.
- Click Severity in the list on the left.
- Click the Severity Stratification report.
- Click IP Risk near the top of the page.
A list of IP risk scores appears in the lower right box. - Click Top Groups, Top Providers, or Top Members at the top of the right box.
- Hover over IP Risk.
Guidelines appear, showing how ranges of IP risk scores correlate to the probability of an inpatient event. These benchmark ranges are determined by Milliman using the MARA calculation.