Insights Dashboards
athenaCollector, athenaClinicals, athenaCommunicator
The Insights Dashboards provide metrics, charts, tables, and tips to help improve practice revenue cycle performance, clinical efficiency, and patient engagement.
 Insights Dashboards — Consolidated Experience (Summer 2026 release )
In the Spring 2021 athenaOne release, we introduced the Insights Dashboards to replace the Sentinel Metrics Dashboard.
The Insights Dashboards provided better performance and offered interactive functionality, with metrics, charts, tables, and tips to improve practice revenue cycle performance.
Over the last few years, we also expanded the Insights Dashboards with metrics and guidance for improving clinical efficiency and patient engagement.
Now, we're introducing an enhanced Insights Dashboards experience to consolidate key metrics and features across dashboards.
- Consolidates all Insights Dashboards into one location within athenaOne, available from athenaOne > Reports menu
- Provides enhanced page layout and navigation
- Introduces new metrics, enhanced benchmarking, expanded drill-down capabilities, and additional export options
Legacy metrics
- Most have been transitioned to the new experience, some are updated/revised, and a few will be retired.
- You can no longer access the Sentinel Metrics Dashboard and original suite of Insights Dashboards pages in athenaOne.
- For details, see this article in the Success Community:
Insights Dashboards Are Being Improved and Consolidated in Summer 2026
We plan to add more metrics in upcoming releases and will provide details in future release notes.
Additional Resources:
- Insights Dashboards Are Being Improved and Consolidated in Summer 2026 — includes the following details:
- What is changing
- Metrics Coming in Summer 2026
- Metrics Coming in Fall 2026 and Beyond
- Metrics Being Retired in Summer 2026
- Legacy Sentinel Metrics Dashboard Being Retired in Summer 2026
-
Summer 2026 release note: Insights Dashboards — Consolidated Experience
How do I get to the Insights Dashboards?
On the Main Menu, click Reports. Under INSIGHTS DASHBOARDS, click a dashboard name.
Important
- If you bookmarked previous Insights Dashboards URLs in your browser (from the suite of Insights Dashboards pages launched in 2021), those bookmarks will no longer work.
- The new consolidated Insights Dashboards now appear inside the main athenaOne window, rather than in separate windows or browser tabs.
- In a future release, you will be able to bookmark Insights Dashboards pages using the Bookmarks feature in athenaOne's Main Menu.
User access and permissions
To access individual dashboard pages
You must have either:
-
The required permission for the dashboard page:
Focus Area Permission needed Financial Performance View Only: Monitor Fee-for-Service Revenue Performance Operational Efficiency View Only: Monitor Fee-for-Service Revenue Performance Clinical Efficiency Insights Dashboards: Clinical Experience Patient Engagement and Experience Insights Dashboards: Patient Engagement OR
-
The Insights Dashboards: View All role
To access the Insights Dashboards — Executive Summary
You must have either:
- ALL of the permissions listed above for specific Insights Dashboards pages
OR -
The Insights Dashboards: View All role
To access Insights Dashboards for athenahealth Services
- The athenahealth service must be enabled for your organization
-
You must have either the required permission for the specific dashboard page:
athenahealth Service Dashboard Permission needed athenaOne® Medical Coding Coding Services: Dashboard athenaOne® Authorization Management Coordinator Standalone: Practice Staff
OR -
The Insights Dashboards: View All role
Important:
What data can a user access?
Provider Group-Based Data Permissions
The data a user can access in the Insights Dashboards depends on whether your practice uses the Provider Group-Based Data Permission feature.
Without the Provider Group-Based Data Permissions feature
Users can view data for the entire organization, including all departments and provider groups, even if they do not have access to all departments or provider groups.
With the Provider Group-Based Data Permissions feature
If your practice has the Provider Group-Based Data Permissions feature enabled, access to data in the Insights Dashboards is restricted to a user's existing provider group data permissions in athenaOne. Therefore, if a user was granted access to at least one department in a provider group on the User Access to Departments page, they can access that provider group’s data in the Insights Dashboards.
To navigate the Insights Dashboards
All Insights Dashboards are in one location inside athenaOne, available from the Reports menu.
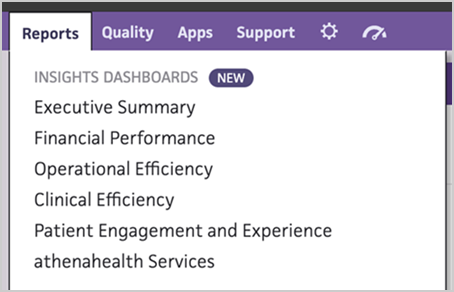
Under INSIGHTS DASHBOARDS, click one of the following:
| Dashboard page | Description |
|---|---|
| Executive Summary |
Use the Insights Dashboards — Executive Summary to review a consolidated overview of key performance drivers at a glance. |
| (Focus area landing pages) — Click a focus area to open a landing page with links to detailed dashboards, a list of metrics, and in some cases, summary metrics | |
| Financial Performance | Analyze how revenue flows through your practice to improve collection performance, reduce delays in payment, and maintain financial stability. |
| Operational Efficiency | Optimize how work moves across your revenue cycle to reduce delays in claims processing, improve throughput, and accelerate time to payment. |
| Clinical Efficiency | Monitor provider and staff efficiency across key clinical metrics. (Unlike other focus area landing pages, this page displays live trend charts rather than links to dashboards.) |
| Evaluate how your patients manage their healthcare and engage with your practice to increase digital engagement, improve the patient experience, and drive practice efficiency. | |
| athenahealth Services |
Monitor how effectively athenahealth's managed services are working on your behalf and where your practice can improve outcomes. Note: The athenahealth Services option only appears in the menu for customers who have contracted with athenahealth for one of these services.
|
To display specific dashboards, click a link to open a detailed dashboard.
- From the menu in the left panel
OR -
From a landing page
For example: To display the Collections dashboard,
From the Financial Performance landing page > click Collections in the left panel or on the landing page to view the corresponding dashboard.
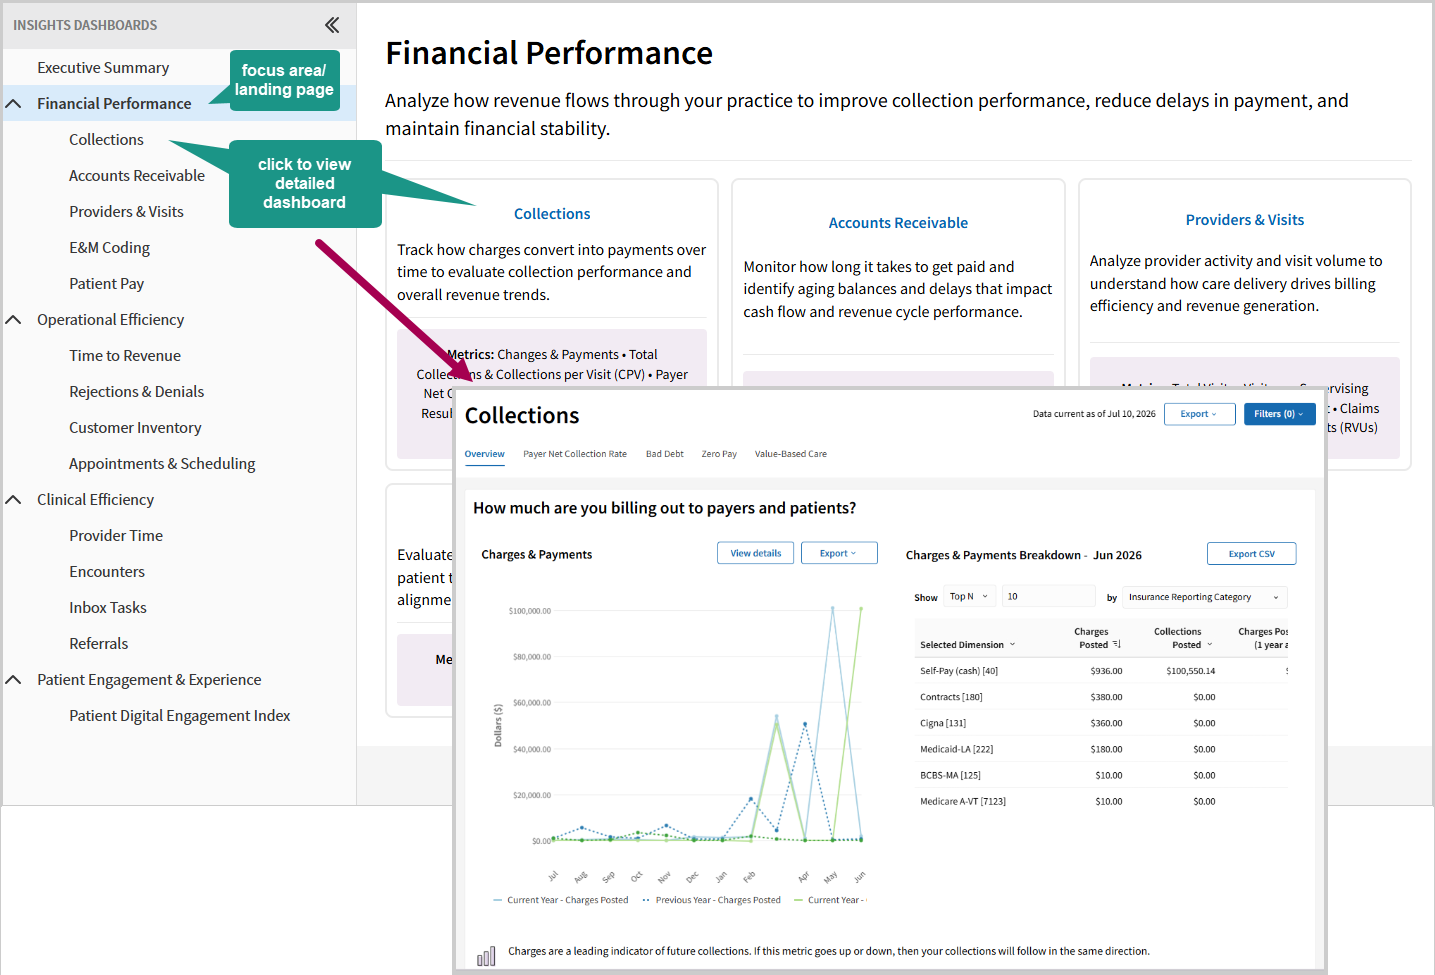
To return to an Insights Dashboard focus area landing page, click the focus area link in the left panel.
Features and workflows
The Insights Dashboards provide metrics, charts, tables, and tips to help improve practice revenue cycle performance, clinical efficiency, and patient engagement.
Using the Insights Dashboards, you can:
- Access comprehensive and consistent revenue cycle performance data in a single location.
- View the raw record data behind charts and tables.
- Learn about missed opportunities and solutions to help your organization increase revenue.
- View benchmarks for certain fee-for-service performance metrics to compare your practice's performance to the performance of other practices on the athenahealth network.
- View benchmarks for certain clinical efficiency performance metrics to compare your practice's performance to the performance of other practices on the athenahealth network, as well as to compare the performance of providers in your practice with the "top performing" and "bottom performing" providers in your practice.
Dashboard metrics are refreshed daily. The latest dashboard refresh date appears on each dashboard.
Key features
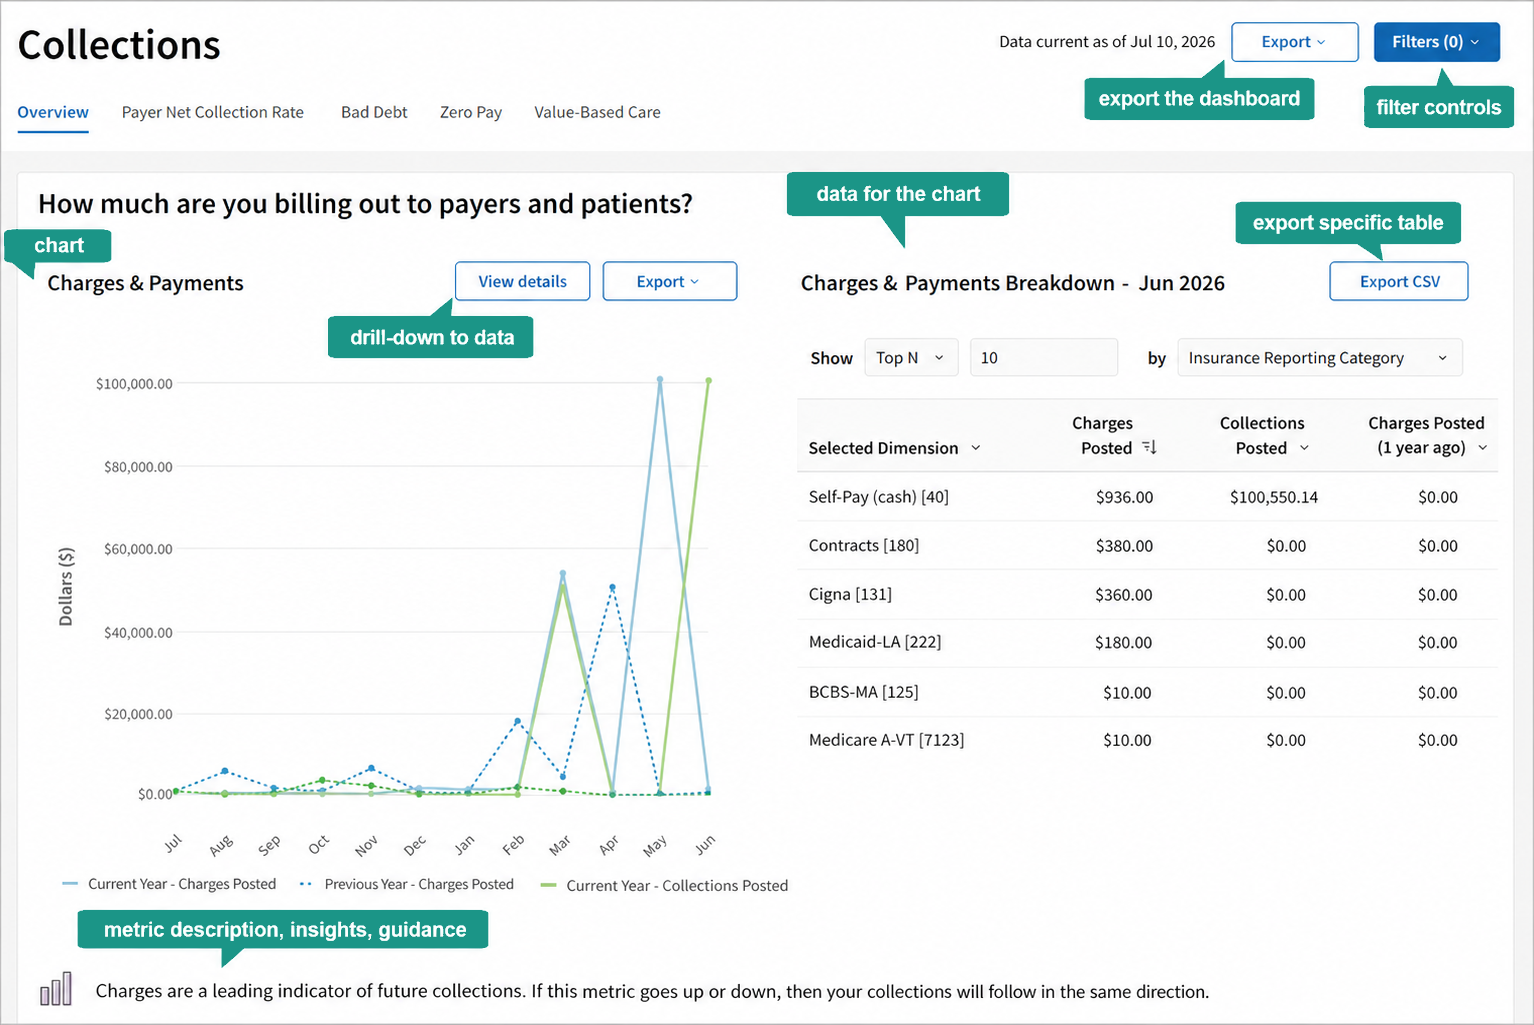
Tip: Click the image to see an expanded view.
| Feature | Details |
|---|---|
| Metric charts and tables | Charts and tables of your organization's performance over time help you visualize the data and compare performance between the current year and the previous year. |
| Metric definitions |
To view metric definitions on the dashboard you're viewing, hover over the metric names in the Breakdown table (if available). |
| Insights and guidance | Review the metric description and interpretive guidance below a chart or table for help understanding performance data and how to improve performance. |
| Filters |
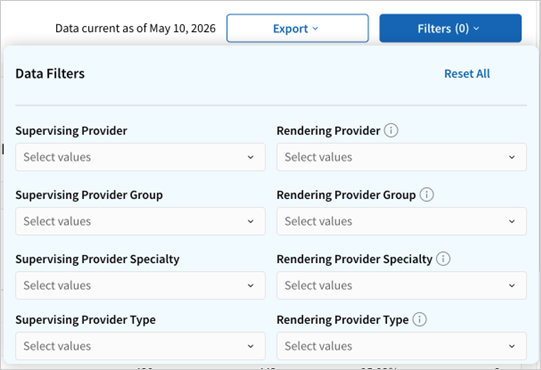
To filter the data on a dashboard, click Filters at the top right of the dashboard header. To filter data for a specific chart or table, use the filter controls above the chart or table. The number in parentheses indicates how many filters have been applied. The filter options you see depend on the metric displayed. Filters example:
Tip: Click the image to see an expanded view.
|
| Drill-down |
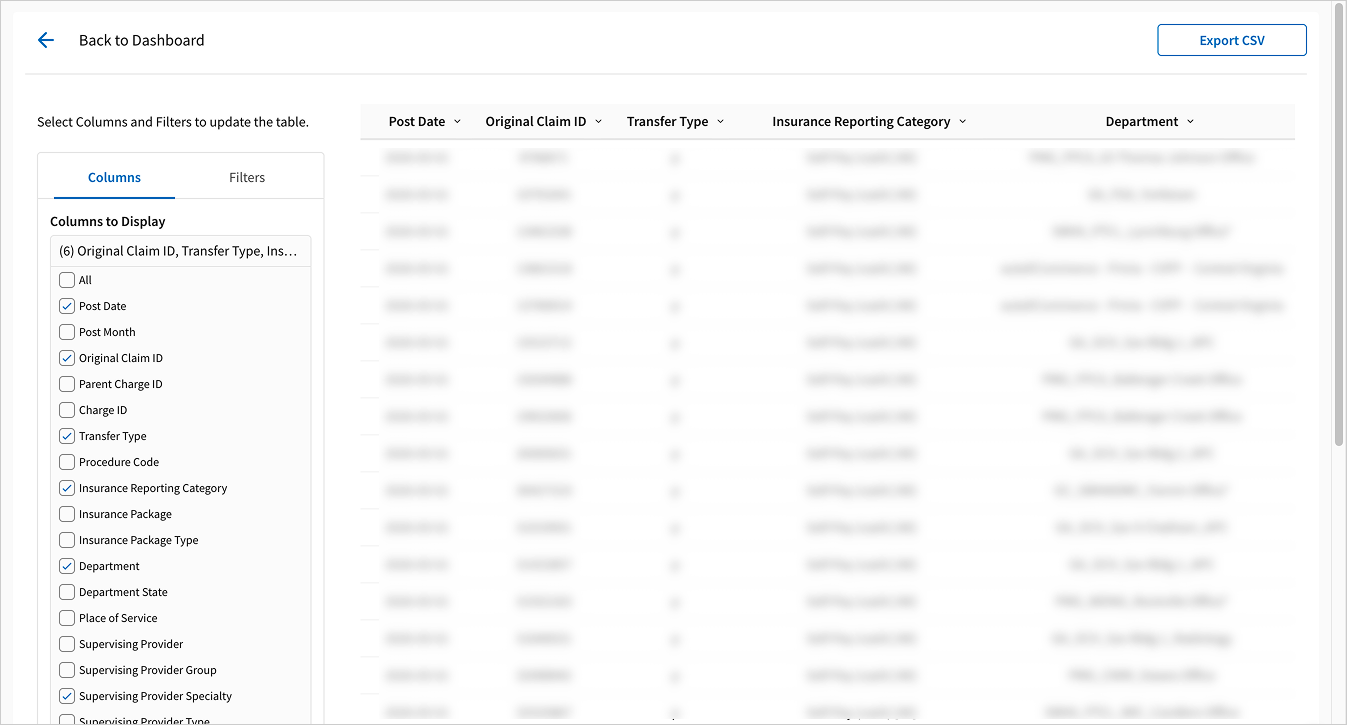
Many charts support direct drill-down to record level data.
Example: View details > data table
Tip: Click the image to see an expanded view. |
| Export |
The export options depend on what you’re exporting. Options include CSV, PNG, and PDF. |
| Performance benchmarks |
You can view benchmarks for certain performance metrics to compare your practice's performance to the performance of other practices in the athenahealth network. For details, see the Performance Benchmarks Details section below. Dashboard data filters are not applied to benchmarks — benchmarks have their own filters. Data for benchmarking refreshes on the 5th of the month. |
| Maximize chart/table | When a chart or table is selected, press the Space bar to maximize it. Press the Space bar again to restore it to its default size. |
| Underlying data | Choose Underlying data from a chart’s context menu to see the chart and its data in a window. |
Performance Benchmarks Details
athenahealth network benchmarks display in many charts.
To view benchmarks, use the controls above the charts that support benchmarks:
- Choose a benchmark to display in the Comparison control.
- Click the Benchmark filters button to narrow the benchmarks to a specific specialty, place of service, provider type, and/or region.
Benchmark filters example:
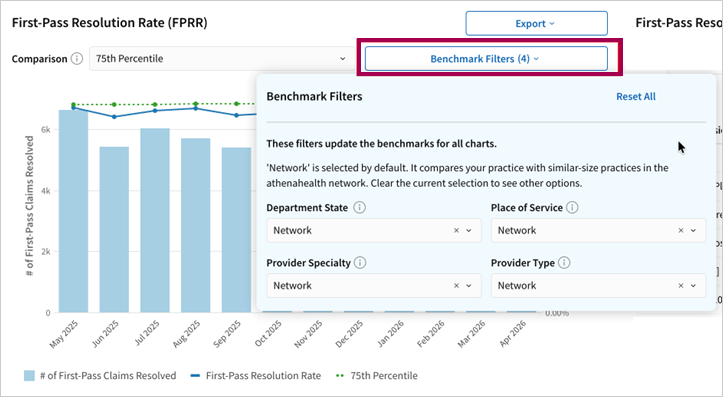
Tip: Click the image to see an expanded view.
The following benchmarks show the average across the athenahealth network for practices of a similar size, based on provider count. (We default the benchmark to a provider count size band based on the provider count of the practice you are logged into.)
- Rejections & Denials:
- First Pass Resolve Rate (75th Percentile)
- Front-End Rejection Rate (75th Percentile)
- Initial Denial Rate (75th Percentile)
- Backend Denial Rate (75th Percentile)
- Time to Revenue:
- Time to Bill (75th Percentile)
- Time to Remit (75th Percentile)
- Time to Close (75th Percentile)
- Clinical Efficiency:
- Same Day Encounter Close Rate % (75th Percentile)
- Provider Documentation Time (75th Percentile)
- Patient Pay
- Patient Pay Yield (75th Percentile)
- Patient Digital Engagement Index
- Patient Digital Engagement Index (75th Percentile)
- Health Information Score (75th Percentile)
- Healthcare Finances Score (75th Percentile)
- Access to Care Score (75th Percentile)
Tip: 75th Percentile is the default, but these other options are also available wherever benchmarks appear: 10th, 25th, 50th, 90th.
Dashboard data filters are not applied to benchmarks — benchmarks have their own filters.
Data for benchmarking refreshes on the 5th of the month.
Benchmarking is also available for the following Insights Dashboards metrics:
- E&M Coding:
- New Patients
- Established Patients
- Compare your practice’s E&M Coding distribution to CMS benchmarks for similar rendering specialties.
- Benchmark E&M coding data is from 2021 (the most recent data available), based on Medicare Part B data published by the Centers for Medicare & Medicaid Services (CMS) and provided electronically by AAPC.
Tip: In the Filters options, choose one value for Rendering Provider Specialty to make the benchmark option available.