Insights Dashboards
athenaCollector + athenaClinicals
athenaOne for Hospitals & Health Systems
The Insights Dashboards provide charts, tables, and tips to improve practice performance with more than 100 key performance indicators. Using the Insights Dashboards, you can access comprehensive and consistent revenue cycle performance data in a single location, and you can learn about missed opportunities and solutions to help your organization increase revenue.
To access the specific Insights Dashboards listed under the landing page category menus, you must have the appropriate data access permissions:
| Category | Permission needed |
|---|---|
| More Collections, Faster | View Only: Monitor Fee-for-Service Revenue Performance
|
|
Benchmarking page or Cross-practice (reporting network) views of the legacy Sentinel Metrics |
View Only: (Context-level) Benchmarking & Cross-Practice Views (Insights Dashboards) |
|
Less Work
Note: These are currently only available for customers who have contracted for Extended Revenue Cycle Management Services: |
|
|
Coding Services: Dashboard |
|
Coordinator Standalone: Practice Staff |
| Improved Clinical Experience | Insights Dashboards: Clinical Experience |
| Improved Patient Experience | Insights Dashboards: Patient Engagement |
Important:
Review What data can a user access? and ensure that the View Only: Monitor Fee-for-Service Revenue Performance permission and View Only: (Context-level) Benchmarking & Cross-Practice Views (Insights Dashboards) permission are granted only to users who should have access to this data.
Provider Group-Based Data Permissions
The data a user can access in the Insights Dashboards depends on whether your practice uses the Provider Group-Based Data Permission feature.
Without the Provider Group-Based Data Permissions feature
The View Only: Monitor Fee-for-Service Revenue Performance permission grants viewing access to the revenue cycle data for the entire organization, including all departments and provider groups, even if a user does not have access to all departments or provider groups.
With the Provider Group-Based Data Permissions feature
If your practice has the Provider Group-Based Data Permissions feature enabled, access to data in the Insights Dashboards is restricted to a user's existing provider group data permissions in athenaOne. Therefore, if a user was granted access to at least one department in a provider group on the User Access to Departments page, they can access that provider group’s data in the Insights Dashboards.
For Benchmarking and Cross-Practice Views
The View Only: (Context-level) Benchmarking & Cross-Practice Views (Insights Dashboards) permission is a context-level permission, designed for users who should have access to data for an entire context and/or across a multi-context organization.
- If a user has access to at least one department within a context, they will be able to view data for that entire context.
- It will not grant access to contexts that the user currently has no access to.
- Currently, this permission grants access to the cross-practice Sentinel metric views for the contexts to which a user has access to within the reporting network
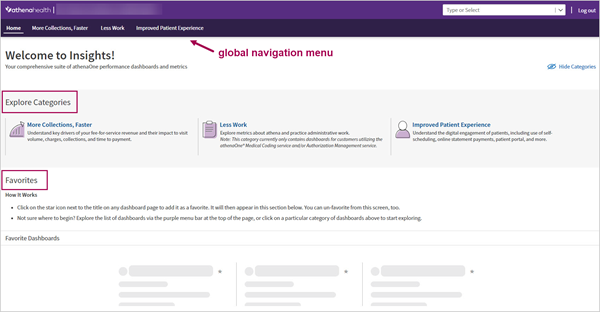
- Global navigation menu:
- Hover over the categories in the menu to view dashboards under each category. Click on a dashboard name to go directly to that dashboard page.
- Click on a category name in the menu bar to go to a sub-landing page with links to specific metrics in that category.
- Explore Categories — Click a dashboard category to go to a sub-landing page with links to specific metrics in that category.
- Favorites — (If you have previously selected favorite dashboards) Click a dashboard name to go directly to that dashboard page.
| Feature | Details |
|---|---|
| To view Insights (information about how to interpret the performance data and how to improve performance): |
Click the Insights button in the right-hand corner.
|
| To display other dashboards: | You can display other dashboards in a number of ways: |
|
|
|
|
|
|
|
|
|
| To return to a dashboard that you previously viewed: |
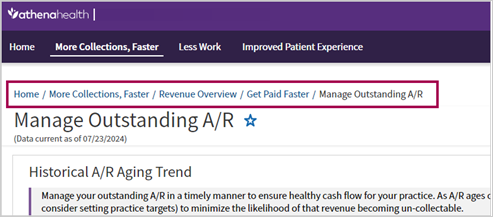
Click a link at the top of the dashboard (these links are also referred to as "breadcrumbs").
|
|
To return to the Insights Dashboard landing page:
|
Click Home at the top left of the page.
|
| To add "favorite" dashboard to your landing page: |
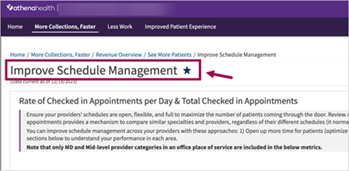
Click the star icon next to the title on any dashboard page. When you go back to the Insights Dashboard landing page, those dashboards will be listed in the Favorite Dashboards section.
To remove a dashboard from your Favorites list, click the solid star icon next to that dashboard name. |
|
To export data from a table or chart: |
Click the export icon — located at the top right of each table and chart — to download the data to a CSV file. The filters and columns you select appear by default the next time you export data.
Note: If you click this icon on the following dashboard pages, the Export detailed datasets window appears, where you can access more granular data, modify the preselected export criteria, and preview the resulting report:
|
| To view Fee-For-Service (FFS) performance benchmarks |
|
-
Display the Insights Dashboards: On the Main Menu, click Reports > Insights Dashboards. The Insights Dashboards landing page appears in a new browser tab.
-
If you are prompted to enter your athenaOne login credentials, enter the following:
-
Username — Enter your athenaOne username.
-
Password — Enter your athenaOne password.
-
-
Click Log In.
The Insights Dashboards appears in a new tab.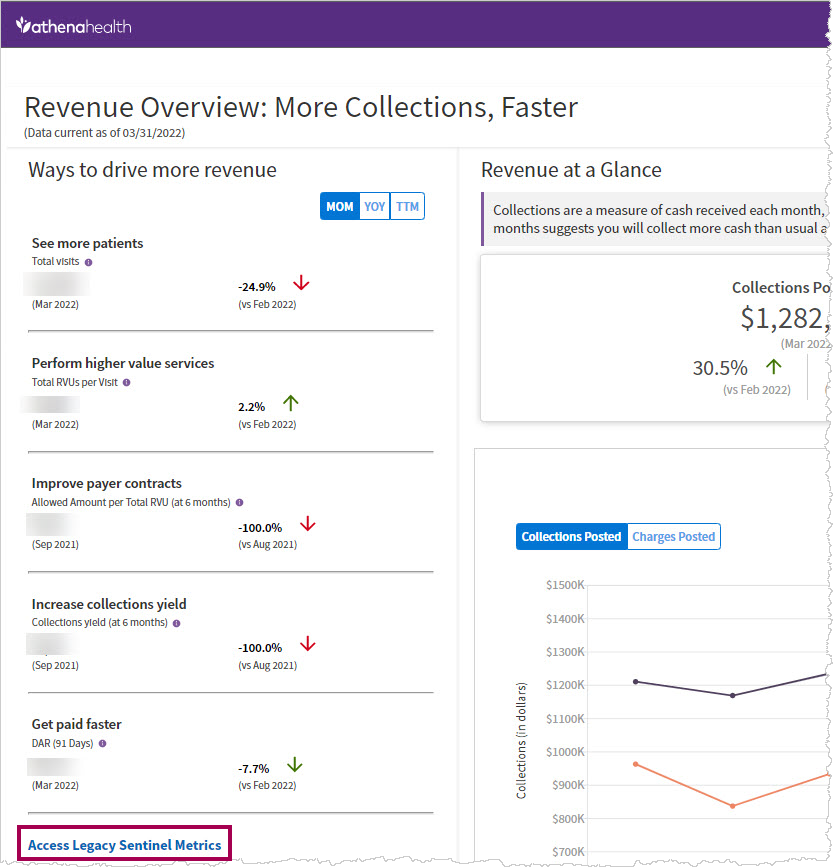
-
Click the link Access Legacy Sentinel Metrics in the lower left panel.
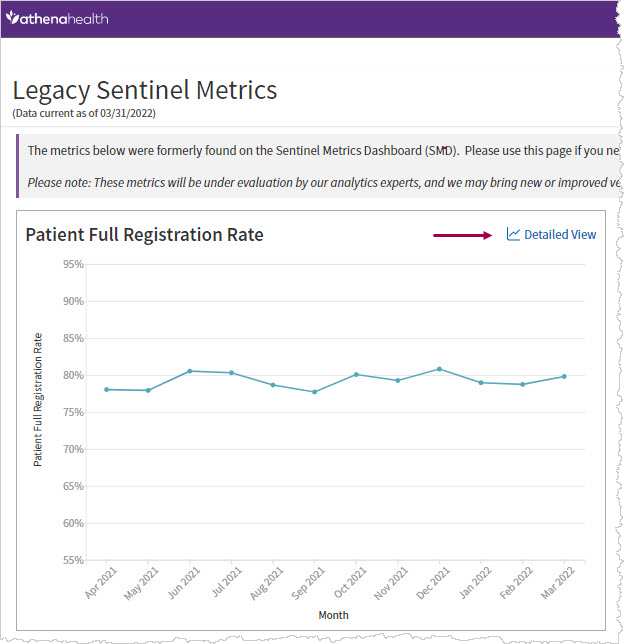
A summary page of the migrated Sentinel Metrics opens. -
To access a detailed dashboard, click Detailed View, located at the top right of any of the metric trends charts. This will direct you to a more detailed view of the metric, with the ability to filter and view the metric by multiple parameters and export the data.
-
If your organization is part of a reporting network:
Click Cross-Practice (Reporting Network) View in the top right of the Legacy Sentinel Metrics dashboard. Note: This link appears only for practices that utilize reporting networks.
Use the Network, Parent, and Context reporting filters at the top of the page to view metrics across the contexts you have access to.
The Insights Dashboards provide charts, tables, and tips to improve practice performance with more than 100 key performance indicators. Using the Insights Dashboards, you can:
- Access comprehensive and consistent revenue cycle performance data in a single location.
- Learn about missed opportunities and solutions to help your organization increase revenue.
-
View benchmarks for certain fee-for-service performance metrics to compare your practice's performance to the performance of other practices on the athenahealth network.
-
View benchmarks for certain clinical efficiency performance metrics to compare your practice's performance to the performance of other practices on the athenahealth network, as well as to compare the performance of providers in your practice with the "top performing" and "bottom performing" providers in your practice.
Dashboard metrics are refreshed by 10:00 a.m. EST daily. The latest dashboard refresh date appears on each dashboard.
Note: You cannot customize the Insights Dashboards. If your organization is interested in a more flexible way to view your data, we recommend that you explore Data View, an athenahealth product that allows you to create your own dashboards. For more information, see Data View Documentation on the Success Community.
For additional information about the Insights Dashboards, see the following articles in the Success Community:
- Insights Dashboards — Frequently Asked Questions (FAQ)
- Insights Dashboards — Metrics and Definitions
-
Clinical Efficiency Insights Dashboards — Metrics and Definitions
Use the Insights Dashboards landing page to explore performance dashboards and pin your favorite dashboards for quick access.
Each Insights Dashboard has the following features.
Key metrics appear at the top of each dashboard and show you whether the metric is trending up or down.

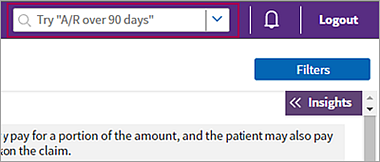
You can navigate to any metric found within the Insights Dashboards with one click. The purple menu bar across the top of all dashboard pages includes a search and browse menu.
- Click the down arrow to display a full list of the metrics, or type a metric name in the box to search for a specific metric.
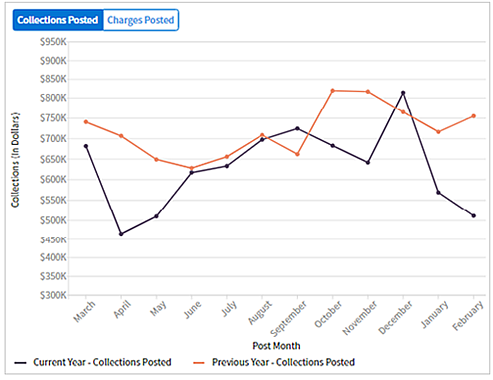
Charts and tables of your organization's performance over time help you visualize the data and compare performance between the current year and the previous year.
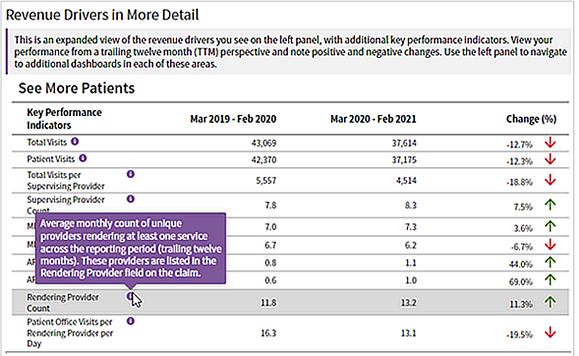
Comprehensive metrics related to areas of performance help you assess performance, including whether the metric is trending up or down. Hover over a metric name with a dotted underline to read each metric definition.
Note: For a list of the metrics on each dashboard and their definitions, see Insights Dashboards – Metrics and Definitions on the Success Community.
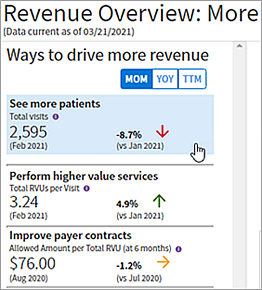
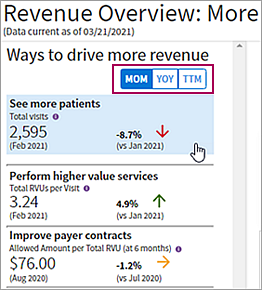
On the left side of many dashboards, you can see ways to improve fee-for-service revenue, along with a key performance indicator for that action. You can view the data month over month, year over year, or over the trailing 12 months. Click the performance area to display its corresponding dashboard.
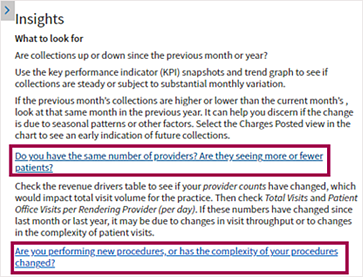
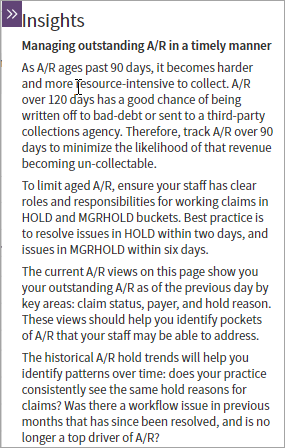
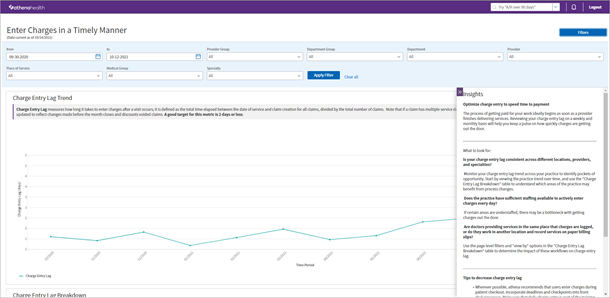
Each dashboard provides insights and guidance to help you interpret the performance data and improve performance. Click the Insights button in the right-hand corner to display this information.

For example, if you click the Insights button on the Manage Outstanding A/R dashboard, the following information appears.
Using the filter fields, you can filter data on a dashboard, for example, by insurance reporting category (IRC), department, provider group, specialty, and place of service. To display the filter fields on the dashboard, click Filters at the top right of the dashboard.
The filter options you see depend on the performance area.

Note: Click Clear all to remove all filters that were previously selected.
Click any filter field to display the filter options. Select the filters that you want from the list and click Apply.
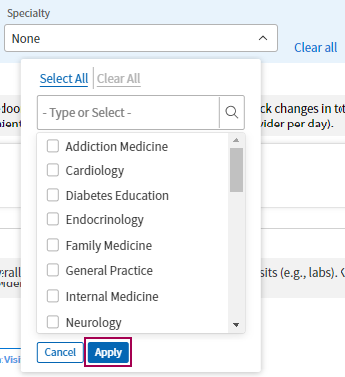
The filtered results appear immediately on the dashboard.
You can view benchmarks in the Insights Dashboards for certain fee-for-service (FFS) performance metrics to compare your practice's performance to the performance of other practices on the athenahealth network.
Benchmarks are available for the following FFS Insights Dashboards metrics:
- Charge Entry Lag
- DAR (91 Days)
- athenahealth DAR
- Client DAR
- Hold DAR
- MgrHold DAR
- Collect DAR
- Collections Yield
- Payer Yield (at 6 months)
- Patient Yield (at 6 months)
- Time of Service (TOS) Collection Rate
- Copay Collection Rate
- Outstanding Balance Collection Rate
- Total RVUs per Visit
-
Modified Work RVUs per Patient Visit
To view FFS performance benchmarks:
- In the Insights Dashboards landing page menu, hover over More Collections, Faster and then click the Benchmarking link.
or
- On the More Collections, Faster sub-landing page, click View Benchmarking.
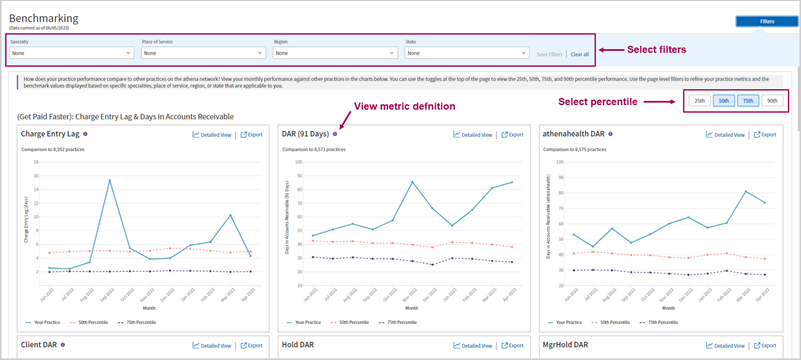
Your 12-month metric performance is displayed against the athenahealth network performance.
- Use the page level filters at the top of the page to further refine your practice performance, as well as the benchmark values displayed, based on a specific specialty, place of service, region, or state.
- Use the toggles at the top right of the dashboard page to display the 25th, 50th, 75th, and/or 90th percentile performance in comparison to your practice performance.
- Hover over the purple info icon next to the chart title of each metric to view metric definitions.
- Click the Detailed View link at the top right of any metric to navigate to a more detailed practice performance dashboard to dig deeper.
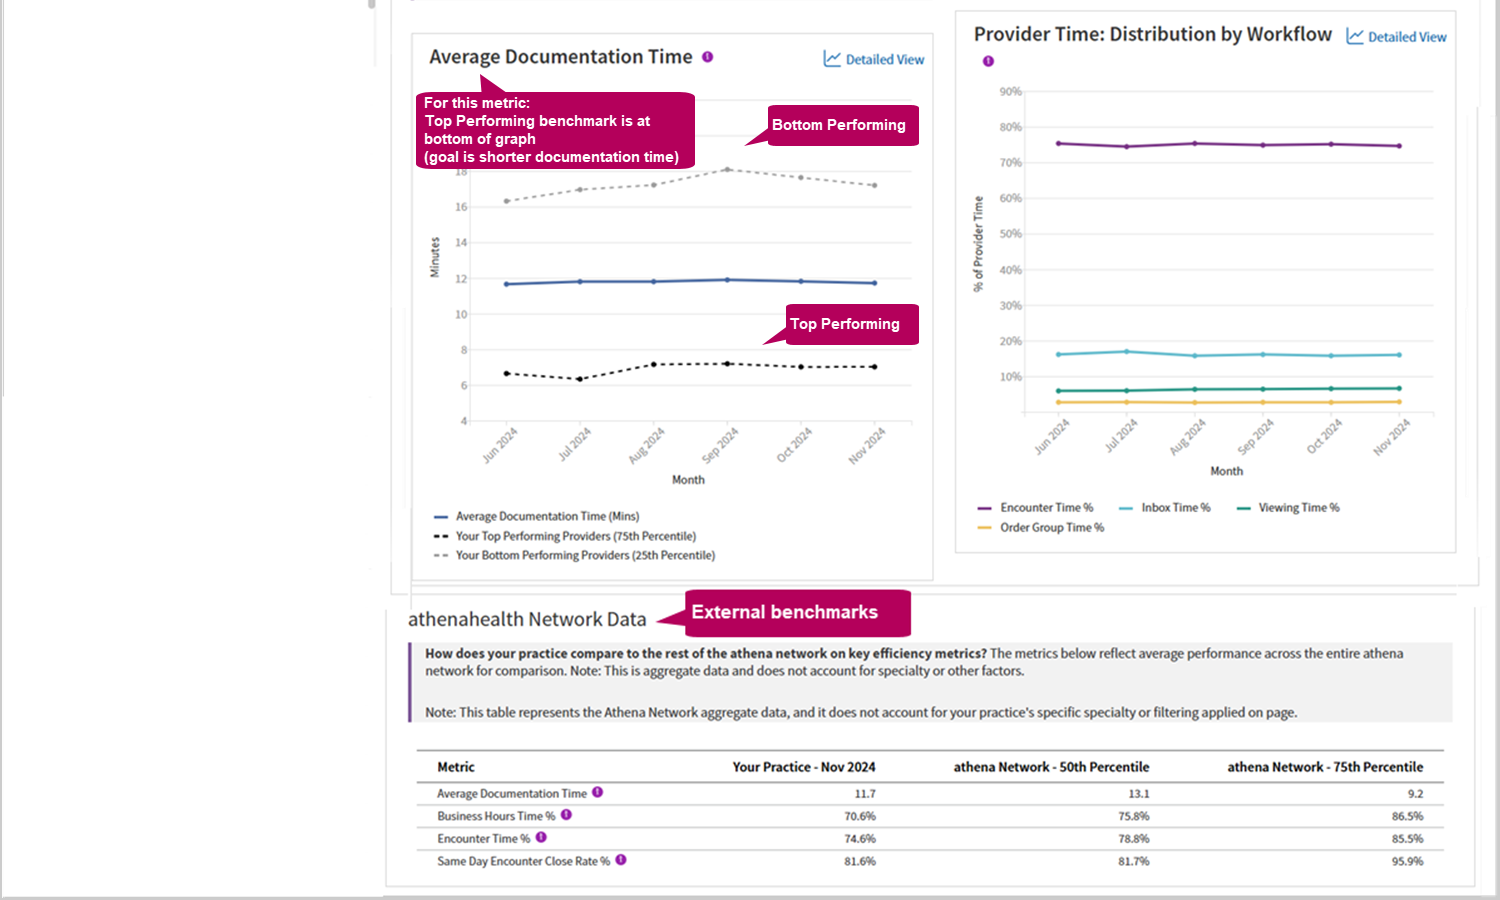
You can view benchmarks for certain clinical efficiency performance metrics to compare your practice's performance to the performance of other practices on the athenahealth network, as well as to compare the performance of providers in your practice with the "top performing" and "bottom performing" providers in your practice.
Benchmarks are available for the following clinicial efficiency Insights Dashboards metrics:
- Total Provider "Business" Time
- Same Day Encounter Close Rate
- Average Documentation Time
On the Improve Clinical Efficiency Insights Dashboards landing page:
- Benchmarks in the metrics charts — Dotted lines display the performance of the "top performing" and "bottom performing" providers in your practice.
- Benchmarks in the Data table — Your practice's performance is displayed along with performance benchmarks from across the athenahealth network for comparison.
Tip: Click the image to see an expanded view
Unlike the metrics in other athenaOne reports, the metrics on the Insights Dashboards are computed from the athenahealth data lake, which is updated between 12:00 a.m. EST and 5:00 a.m. EST. Therefore, data entered after 12:00 a.m. EST does not appear on the Insights Dashboards until the following day.
Occasionally, transactions from the previous day may not appear on the Insights Dashboards because the data update occurred before all associated pieces of data were updated. For example, a voided transaction on a claim may be in the data lake before the associated claim ID. These errors are corrected the following day, but you may notice a small difference between other athenaOne metrics and Insights metrics.
You can continue to use the Sentinel Metrics Dashboard to review your organization's performance metrics. The Sentinel Metrics Dashboard includes metrics that are not available on the Insights Dashboards.
Note: Most metrics on the Sentinel Metrics Dashboard will be moved to the Insights Dashboards. When a metric is removed from the Sentinel Metrics Dashboard, athenahealth will notify you in advance.
Some metrics on the Insights Dashboards are completely new. For example, most of the metrics related to scheduling have not previously been available. A few categories of metrics are based on other reports or dashboards in athenaOne, but the Insights Dashboards calculate them differently.
Insights Dashboards metrics related to fee-for-service revenue are based on activity reports generated from the Activity Wizard. Typically, these metrics use the date of service, but some Insights Dashboards metrics (for example, Collections Posted and Charges Posted) use the post date, which is the date that charges or collections are entered into athenaOne.
Some fee-for-service metrics are "at 6 months." This means that athenahealth is capturing the metric six months after the date of service. Six months allows for enough time to resubmit claims to payers that require additional details and to receive EOBs and post payments.
On the Sentinel Metrics Dashboard, time-of-service metrics do not account for patient prepayments or prepayment plan down payments.
On the Insights Dashboards, time-of-service metrics account for patient prepayments, and you can see the breakdown of prepayments, in-office collections, and the total collections related to the appointment on the dashboard. Prepayment plan down payments are added to the time-of-service collected and total outstanding collected.
Zero-pay claims or charges that appear on the Insights Dashboards can also be found on the Zero Pay Review page. On the Insights Dashboards, these claims and charges are attributed to the date that the payer adjustment was posted in athenaOne; on the Zero Pay Review page, zero-pay claims and charges are attributed to the creation date of the adjustment in athenaOne.
For the most part, there is no difference between the date that the adjustment was posted and the date that the adjustment was created in athenaOne; therefore, you should not see any difference between metrics on the Insights Dashboards and metrics on the Zero Pay Review page. In the unlikely event that there is a difference, the posted adjustment date is a better reflection of when the adjustment was logged in athenaOne than the creation date.
Each Insight Dashboard is briefly described in this section.
For additional information about the Insights Dashboards, see the following articles in the Success Community:
- Insights Dashboards — Frequently Asked Questions (FAQ)
- Insights Dashboards — Metrics and Definitions
-
Clinical Efficiency Insights Dashboards — Metrics and Definitions
- The Revenue Overview: More Collections, Faster dashboard displays metrics on revenue, including the latest performance on the leading indicators of revenue, collections, and charges.
- You can also see quick comparisons over time (for example, year over year, month over month, or trailing 12 months).
- Use this dashboard to review a high-level overview of revenue performance and learn where you can dig deeper.
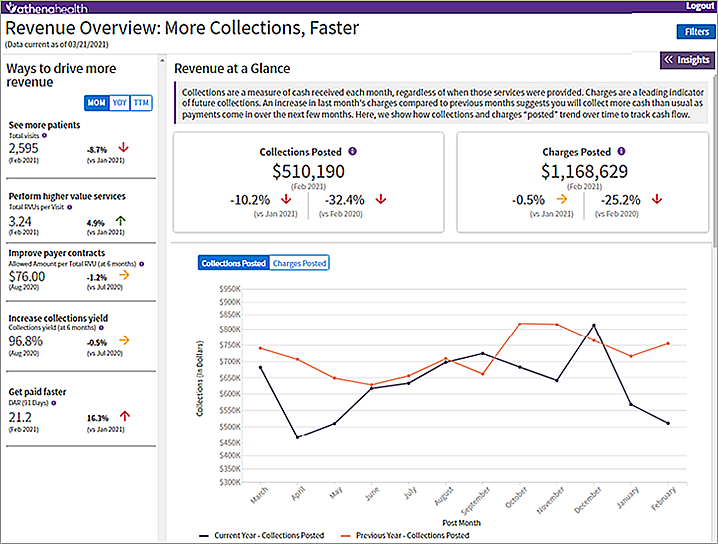
From the Revenue Overview: More Collections, Faster dashboard, you can access these dashboards:
- See More Patients
- Perform Higher Value Services
- Improve Payer Contracts
- Increase Collections Yield
- Get Paid Faster
The See More Patients dashboard displays metrics on visit volume and trends, provider counts, and provider workdays. Use this dashboard to uncover potential opportunities to get more patients in the door.
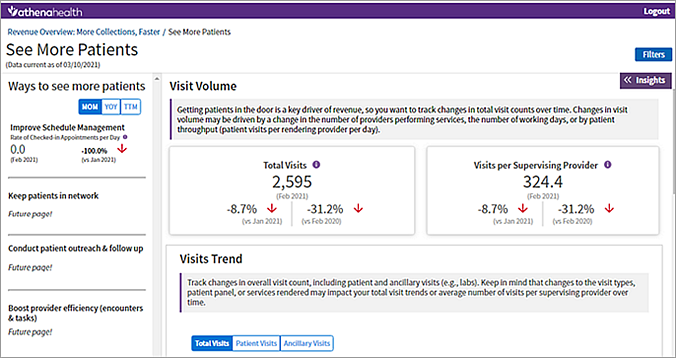
From the See More Patients dashboard, you can access these dashboards:
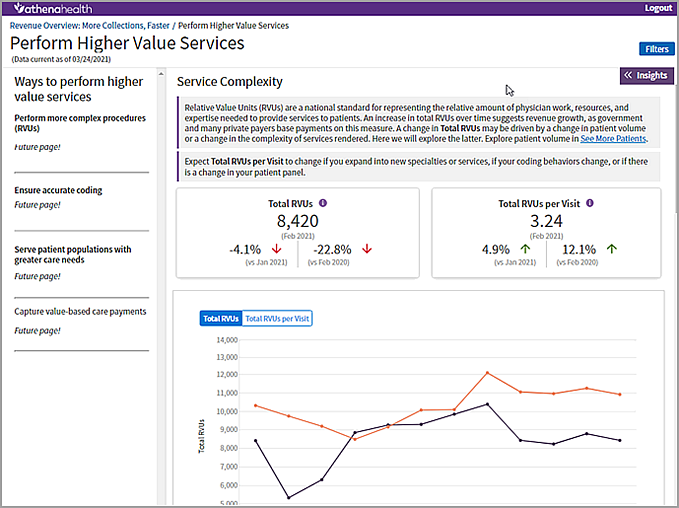
The Perform Higher Value Services dashboard displays metrics on the value and complexity of services provided over time. Use this dashboard to understand overall provider productivity and service mix.
The Improve Payer Contracts dashboard displays metrics on payer reimbursement; these metrics are measured by the allowed amount per relative value unit (RVU). athenahealth allows six months to elapse from the service date before capturing the metric. Use this dashboard to analyze your payer mix and contracted rates.
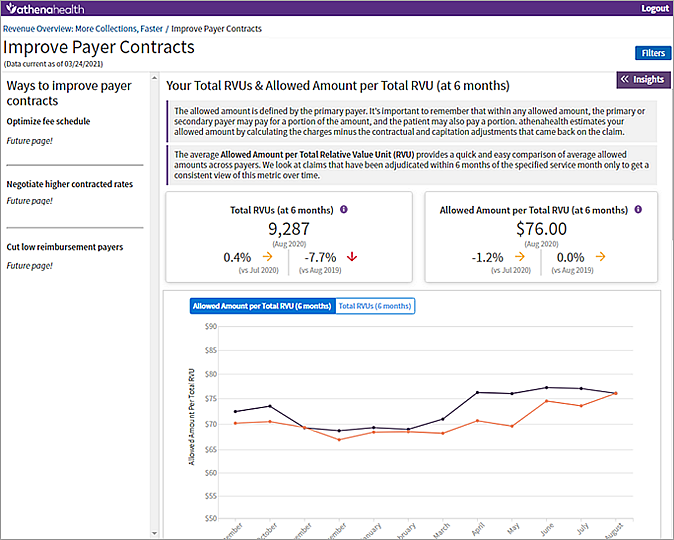
From the Improve Payer Contracts dashboard, you can access these dashboards:
The Increase Collections Yield dashboard displays metrics on your organization's collections yield and yield loss. You can view the breakdown of the percentage of total allowable dollars that contribute to yield or yield loss. Two versions of the collections yield and yield loss metrics are available:
- One version is captured at six months from the service date to provide consistent measurement over time.
- One version is current to provide an updated view by service month as of the previous day.
Use this dashboard to understand collection yield and how it can be improved.
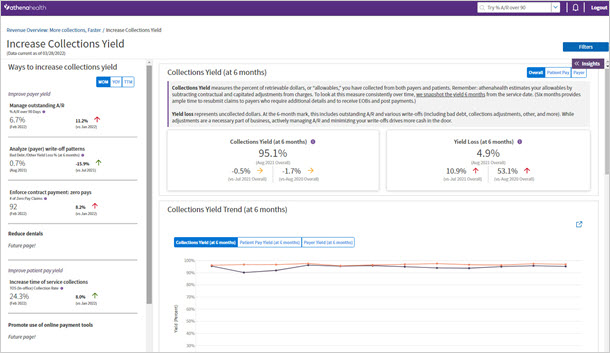
From the Increase Collections Yield dashboard, you can access these dashboards:
The Get Paid Faster dashboard displays metrics on your Days in Accounts Receivable (DAR). Use this dashboard to understand how long it takes your practice to get paid.
Note: This dashboard includes the Client Days in Accounts Receivable (Client DAR) metric, which was previously available in the Sentinel Metrics Dashboard.
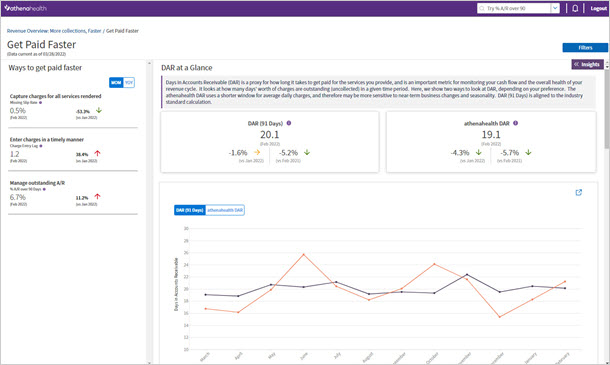
From the Get Paid Faster dashboard, you can access these dashboards:
The Insights Dashboards takes snapshots on the first day of each month to calculate the average daily charges and outstanding A/R values that are used to populate the athenahealth DAR, DAR (91 Days), and Client DAR metrics for the previous completed month on the Get Paid Faster dashboard. The Insights Dashboards continue to refresh these metric values through the 7th day of each month to capture changes made to the previous month's data.
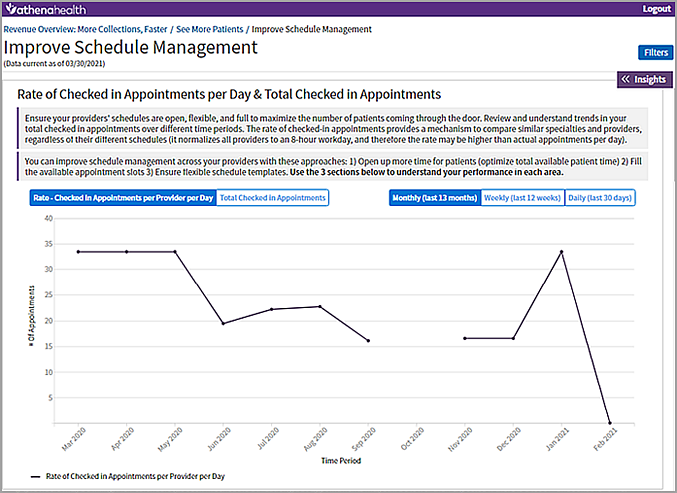
The Improve Schedule Management dashboard displays metrics on the rate of checked-in appointments, available appointment opportunities, and more. Use this dashboard to find opportunities to open up more time for patients, fill available appointment slots, and ensure flexible schedule templates.
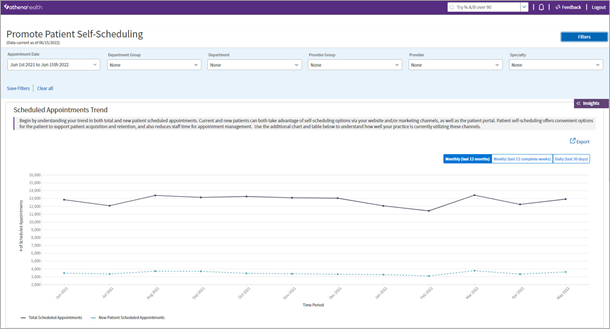
The Promote Patient Self-Scheduling dashboard displays the daily, weekly, and monthly trends in bookings by channel, including practice scheduling, portal, patient self-scheduling via marketing channels, or other (Partner / Interface). You can view these metrics split out by both new and existing patients.
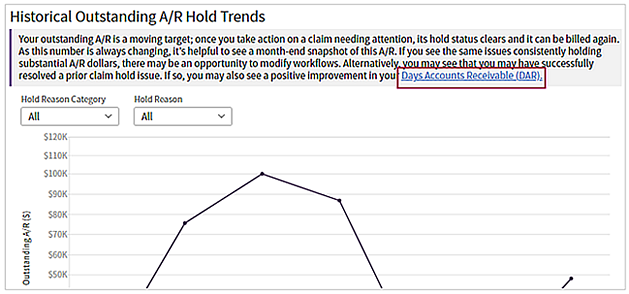
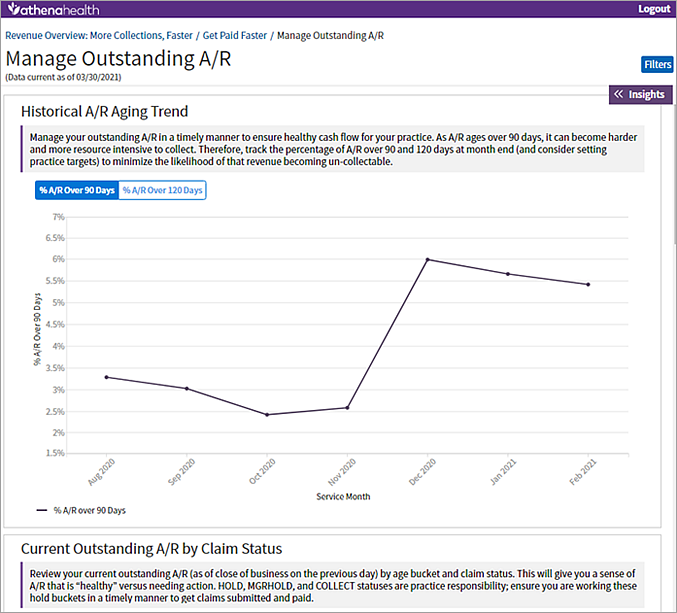
The Manage Outstanding A/R dashboard displays metrics on historical accounts receivable (A/R) aging trends and current A/R aging trends. Use this dashboard to understand A/R trends so you can minimize the likelihood of revenue becoming uncollectable.
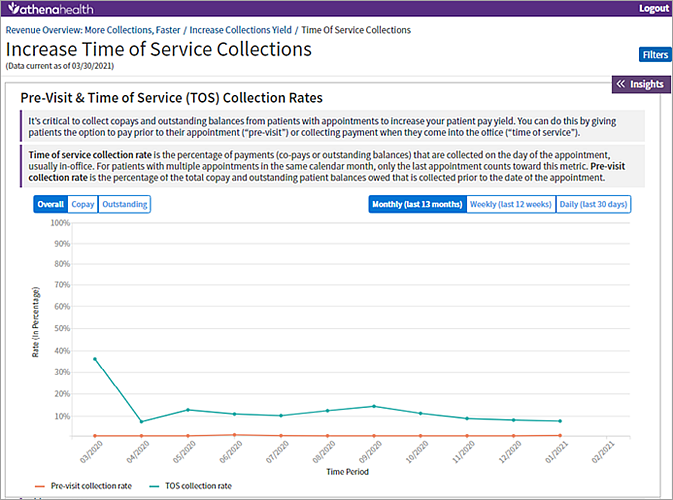
The Increase Time of Service Collections dashboard displays metrics on your organization's pre-visit and in-office collection rate. Use this dashboard to understand current collection trends and identify areas and opportunities to increase patient collections before or at the time of service.
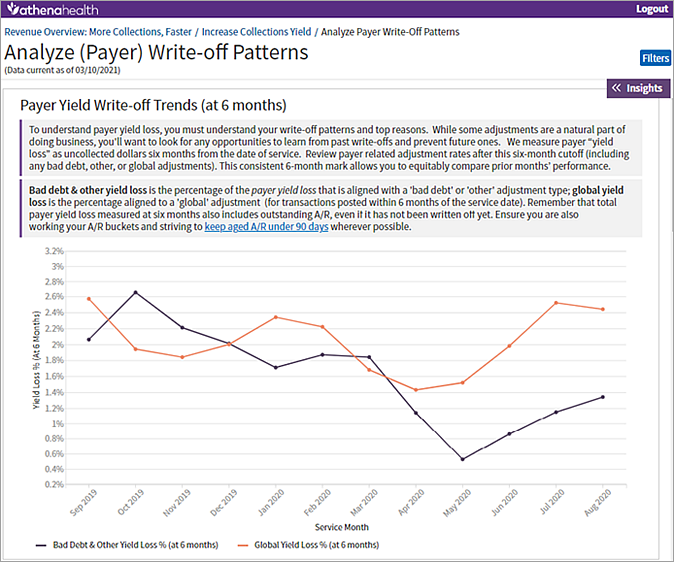
The Analyze Payer Write-off Patterns dashboard displays metrics to help you understand payer yield loss in more detail, including drivers of bad debt and global or other adjustment types. Use this dashboard to understand yield loss due to these adjustments to determine whether you can avoid some of them in the future.
The Enforce Contract Payment: Zero Pays dashboard displays key performance metrics related to your practice's zero-pay volume and recovery rates, such as:
-
Total zero-pay charges
-
Dollar value of zero-pay charges
-
Number of zero-pay resubmissions
-
Revenue recovered from resubmissions
Use this dashboard to analyze zero-pay metric trends and top drivers, such as specific payers or procedure codes, and to prioritize your efforts on the zero-pay claims that have the most likelihood of being paid. (You may also consider whether you can prevent similar zero pays in the future.) When you understand the trends, you can use the Zero Pay Review tool to create criteria that correspond to the success criteria you find on the dashboard.
For more information about zero-pay charges, see Zero-Pay Review.
The Enter Charges in a Timely Manner dashboard displays your charge entry lag — that is, how long it takes you to enter charges after a visit occurs. Charge entry lag is defined as the total time elapsed between the date of service and claim creation for all claims, divided by the total number of claims. Use this dashboard to:
- View your metric trends on a monthly, weekly, or daily basis
- Understand which departments, providers, specialties, and places of service are the top drivers of overall practice performance in this area
Best practice: A good target for the charge entry lag metric is 2 days or less.
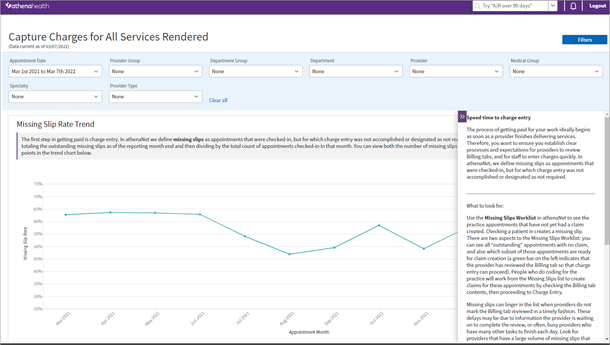
The Capture Charges for All Services Rendered dashboard displays metrics on your practice's missing slips rate trend. Missing Slips include appointments that were checked-in, but for which charge entry was not accomplished or designated as not requiring charge entry. A missing slip may indicate the provider rendered services but a billing slip has not yet been created for that work. Use this dashboard to:
- Look at the monthly missing slip rate trend, which is calculated by totaling the outstanding missing slips as of the month end and then dividing by the total count of appointments checked-in during the period.
- View the count of missing slips on a monthly, weekly, or daily basis for each appointment date (this data is updated each day).
- Use the interactive visualizations to understand which departments, providers, provider groups, or specialties are the top drivers of overall practice performance in this area.
Best practice: Although the missing slips rate metric can also be accessed by clicking the link to the monthly Practice Performance Reviews on the Performance Reviews page, we recommend accessing this metric in the Insights Dashboards.
Explore metrics about athenahealth and practice administrative work:
- athenaOne® Medical Coding service
- athenaOne® Authorization Management service
- athenaOne® Enhanced Claim Resolution service
The athenaOne® Medical Coding Performance Dashboard provides transparency into key performance indicators (KPIs) related to the athenaOne Medical Coding service, including:
- Service utilization rate
- Turnaround times
- Amount of work done by athenahealth's coding team independently
- Amount of work where the coding team needed your practice's assistance
- Time to Bill
- Evaluation and Management (E&M) distribution
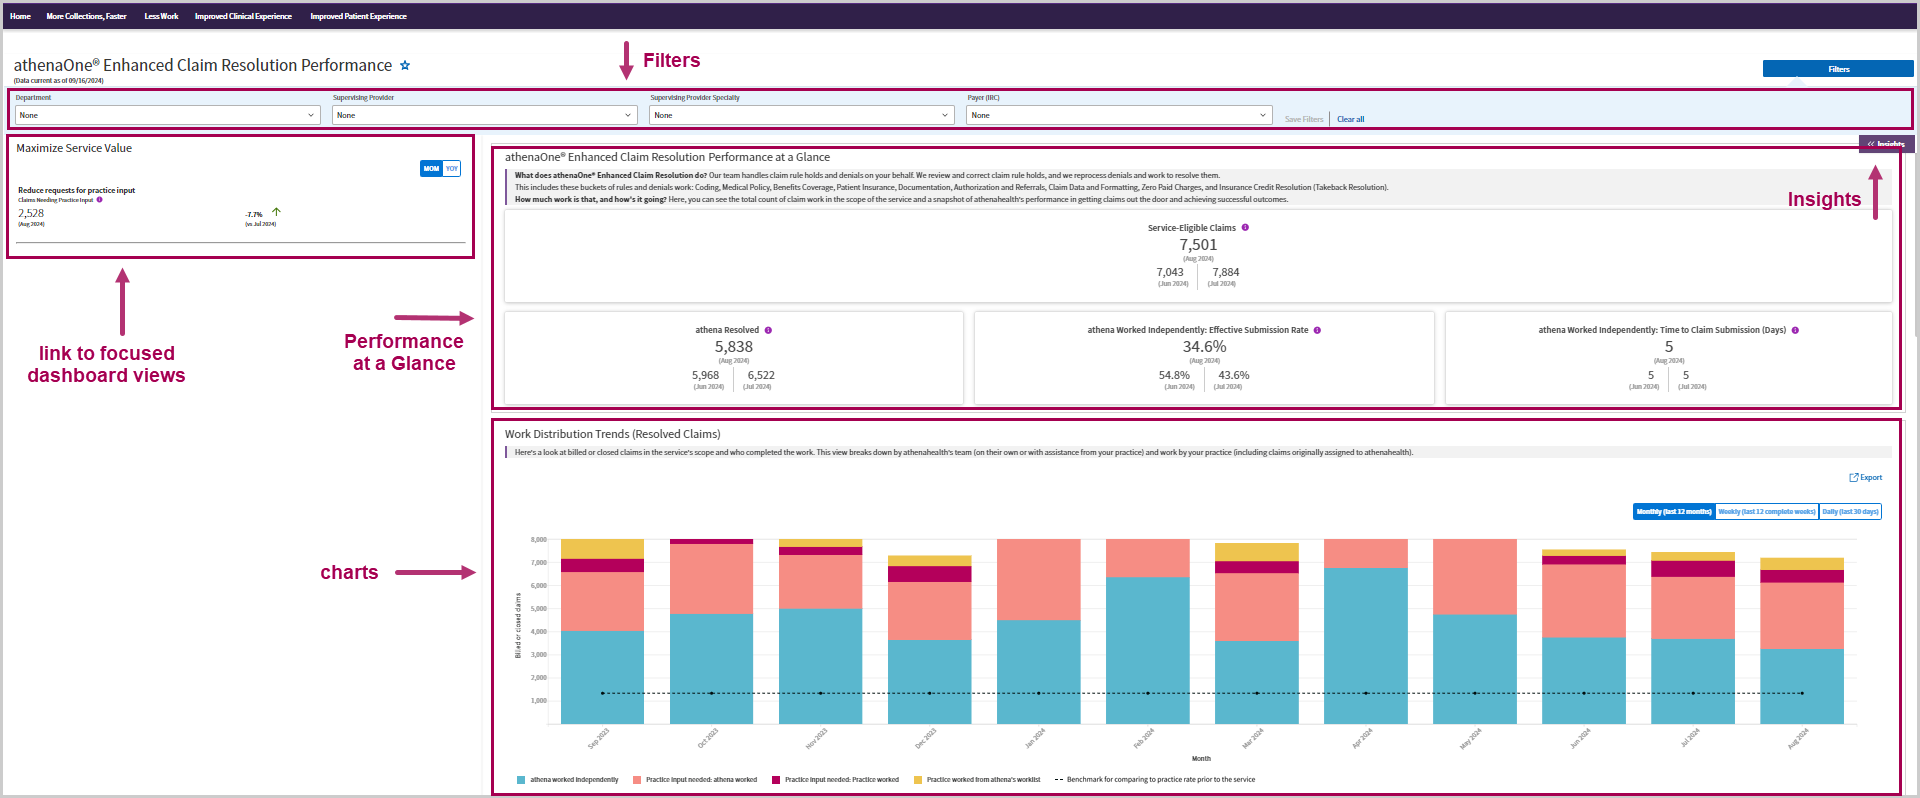
The athenaOne® Enhanced Claim Resolution Performance Dashboard provides transparency into key performance indicators. related to the athenaOne® Enhanced Claim Resolution service, including:
-
Amount of work done by athenahealth independently
-
Amount of work where the athenahealth team needed your practice's assistance
-
How effective the claim work is at securing a payment or transfer to the next responsible party
-
Average work times between receiving the claim rule hold or denial and billing it out
Note: Currently, the dashboard is available only to existing customers who were already using athenaOne and then later added the Enhanced Claim Resolution service. In a future release, we will consider making the dashboard available to customers who have the service as part of their athenaOne onboarding.
Tip: Click the image to see an expanded view
The Clinical Efficiency Insights Dashboards are a collection of curated metrics designed to provide comprehensive insights into clinician performance within athenaClinicals.
These dashboards can help empower practice administrators to make informed decisions that enhance operational efficiencies, improve clinician performance, and increase productivity.
![]() Watch a demo video — Clinical Efficiency Insights Dashboards
Watch a demo video — Clinical Efficiency Insights Dashboards
From the Improve Clinical Efficiency dashboard, you can access these dashboards:
- Improve Clinical Efficiency
- Optimize Provider Time
- Increase Encounter Efficiency
- Boost Inbox Task Productivity
A list of all Clinical Efficiency Insights Dashboards - Metrics and Definitions is available on the Success Community. Some metrics have additional notes and examples to help you better understand the data.
The Optimize Provider Time dashboard displays metrics on how providers manage their work during business hours versus after hours.
Use this dashboard to understand workload patterns and assess resource allocation.
Provider Time metrics data includes all rendering providers with a closed encounter within the month.
The Increase Encounter Efficiency dashboard displays metrics on how efficiently encounters are closed.
Use this dashboard to identify opportunities for clinicians and clinical staff to leverage product features and clinical accelerators that can help improve efficiency.
The Boost Inbox Task Productivity dashboard displays metrics related to clinical Inbox task management, productivity, and usage.
Use this dashboard to:
- Understand the number of outstanding tasks in your inbox, their age, and the lag to respond to patient cases.
- Identify opportunities to leverage product features and accelerators that can help improve efficiency.
Understand the digital engagement of patients, including use of self-scheduling, online statement payments, patient portal, and more.
- Patient Digital Engagement Index
