QA UDS Table 6A
athenaCollector + athenaClinicals
This topic focuses on Uniform Data System (UDS) reporting. Use this topic to learn more about how to QA Table 6A: Selected Diagnoses and Services Rendered.
This table reports the number of UDS visits and unique patients per diagnosis or service rendered across medical, mental health, substance abuse, vision, and dental providers during the reporting year. Dental lines appear only if your dental system is integrated with athenaOne and the Practice Setting UDS Dental Integration is enabled. For more dental details, see the UDS Guide to Success.
Note: The UDS Table 6A -Selected Diagnoses and Services Rendered report supports SNOMED codes. However, this does not apply to claim SNOMED codes because SNOMED codes are not entered directly onto claims. The logic for clinical encounters makes athenaOne only use the SNOMED codes that you specifically entered in the encounter.
According to UDS specifications, athenahealth excludes the visit types below in Table 6A calculations:
-
Case Management
-
Health Education
-
Physical Therapy
-
Acupuncture, Massage Therapy
-
Podiatry
-
Audiology
-
Naturopath
-
Respiratory Therapy
-
Chiropractic
-
Nutritionist
-
Speech Therapy
-
Community Health
-
Occupational Therapy
-
Traditional Healing
-
Herbalist
The contents of table 6A are populated using documented diagnosis codes (regardless of primacy) and procedure codes associated with claims and encounters for a valid UDS visit. Any diagnoses or procedures that do not have the proper codes listed on an encounter or claim are not included
Note: The PROCEDURECODES column indicates the procedures associated with this UDS visit. If your practice uses other procedure codes and diagnosis codes to represent diagnostic categories, such as unique state billing codes, these are only recognized by athenaOne’s UDS reporting logic if updated in the inclusion/exclusion logic and override functionality.
From the Main menu: Reports > Report Library > UDS tab > UDS Table 6A
This table buckets visits and patients by selected diagnoses and selected services rendered.
This section describes relevant logic that is used to identify or categorize data for this table.
This data is calculated by counting the UDS visits where the claim or clinical encounter has one of the applicable diagnosis or procedure codes documented.
-
This data is calculated by counting the distinct patients that have UDS visits where the claim or clinical encounter has one of the applicable diagnosis or procedure codes documented.
In addition to the basic logic above, the UDS Manual has very strict requirements for the situations in which a test (e.g., mammograms, X-rays) should be counted for UDS reporting in Table 6A. Please review the UDS Manual Table 6A section (pg. 73) for more details. Below is the logic that describes how athenahealth implements those test reporting requirements for the purposes of Table 6A.
-
athenahealth counts completed test results that have not been deleted.
-
athenahealth assumes that test results will only be evaluated as part of a Medical visit. athenahealth will only count test results for 6A if there is a Medical visit to which they can be tied (as opposed to Dental visit, etc.).
-
athenahealth will not count a test result for Table 6A unless there is a Medical visit within the reporting period to which it can be tied. If a health center receives a test result but there is no Medical visit for the patient, athenahealth will not count the result on Table 6A.
-
If there is a visit with a procedure code and a corresponding test result, athenahealth will count the procedure code and test result as part of a single visit for Table 6A purposes. This test result will not count with another Medical visit. This prevents double counting a lab for two different UDS visits.
-
athenahealth does not make assumptions about when the test result is returned to the health center or when results are reviewed with a patient. This means that test results can be associated with visits whether the test result is documented first or the visit is documented first.
Also, as stated in the UDS Manual, if a single UDS visit is associated with procedures or diagnoses from multiple rows, the visit and patient will be counted in multiple rows.
If a clinical quality measure is manually satisfied by a clinician for a patient’s condition but the associated codes are not present on the claim or encounter, a patient might appear on Table 6B, 7B or 7C (which are populated based on eCQMs), but not on Table 6A, because Table 6A’s backing logic requires proper codes in order to include encounters or claim.
This section describes the data sources for this table and where you can view that data within athenaOne.
Note: Hover over the image for a closer look.
Note: Hover over the image for a closer look.
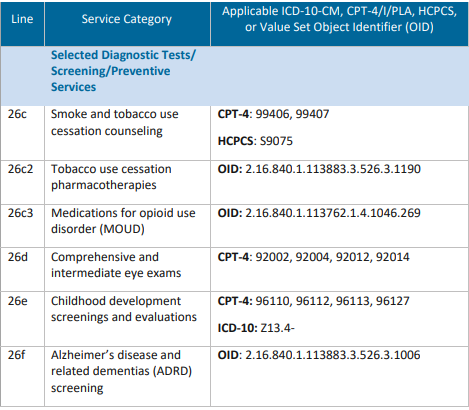
Additionally, these measures and reporting lines have been added to capture priority areas, per the 2025 UDS PAL specification from HRSA:
- Tobacco Use Cessation Pharmacotherapies Line 26c2 identifies the number of visits where patients received tobacco cessation pharmacotherapies as an intervention and the number of patients who received this pharmacologic treatment. This line for reporting of tobacco use cessation pharmacotherapies promotes greater understanding of the breadth of tobacco cessation interventions provided at health centers, specifically allowing HRSA to observe differences in tobacco use cessation approaches.
- Medications for Opioid Use Disorder (MOUD) Line 26c3 records the number of visits where MOUD was administered and the number of patients who received this medication-based intervention. This line enhances the existing MOUD-related measures that health centers currently report in Appendix E: Other Data Elements (e.g., number of providers who treat opioid use disorder with MOUD).
- Alzheimer's Disease and Related Dementias (ADRD) Screening Line 26f captures the number of visits where patients received ADRD screenings and the number of patients who received the screenings. This line encompasses assessments representing standardized tools used for the evaluation of cognition and mental status of older adults. The addition of this line captures ADRD screenings that will be valuable in understanding the level of need and resources required to continue to support the growing aging population served by the Health Center Program. Integrating this measure will enhance the UDS’ alignment with other national initiatives, such as the Healthy People 2030 objectives and the National Plan to Address Alzheimer’s Disease.5\ 5 ASPE National Plan to Address Alzheimer's Disease Screening for ADRD is increasingly recognized as a critical component of comprehensive primary care, particularly in health centers serving older populations.
-
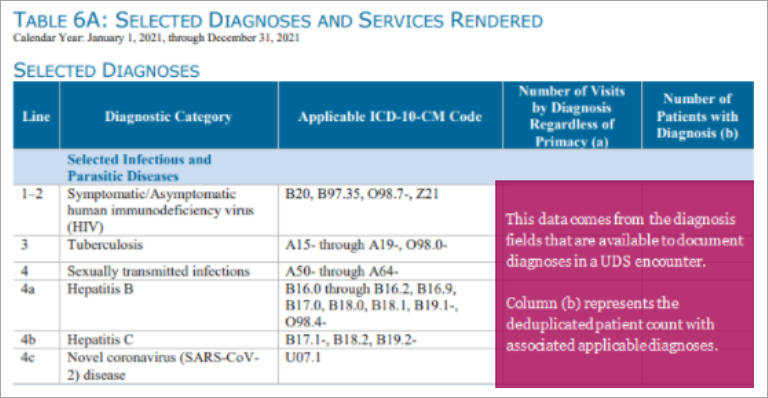
This data comes from the diagnoses documented during a UDS Visit on the claim or encounter.
-
This data can be viewed on the Encounter Summary or by using the CLAIM_ID field to directly view the relevant claim and review the “Diagnosis Codes” fields.
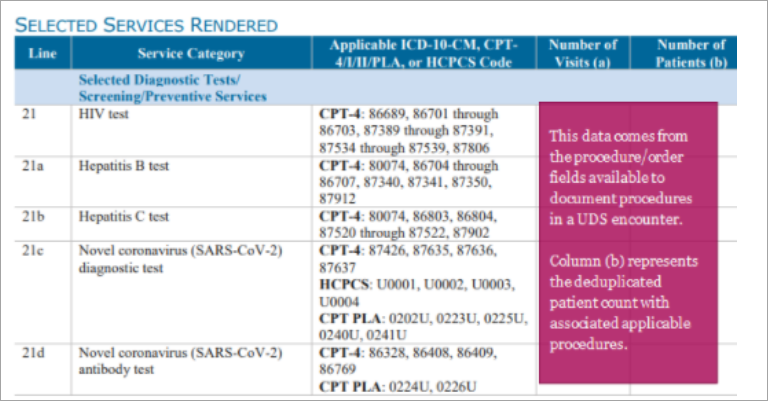
This data comes from the procedures documented during a UDS Visit on the claim or encounter.
This data can be viewed on the Encounter Summary or by using the CLAIM_ID field to directly view the relevant claim and review the “Charges” section.
This section provides examples of how to trace pieces of data from the Rolled Up report back to athenaOne.
athenaOne action:
-
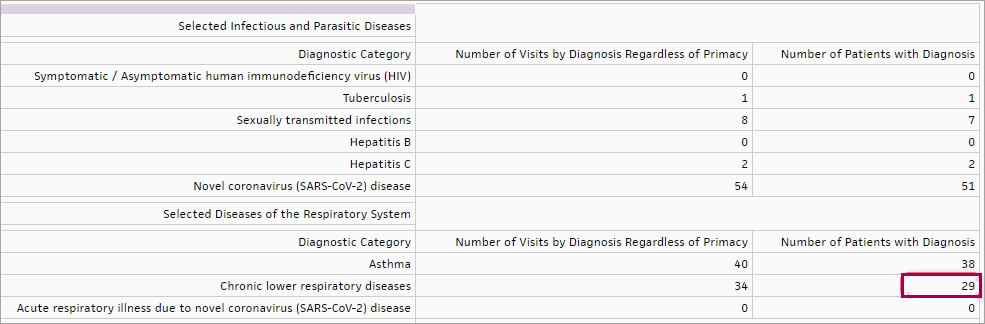
Beginning with the Rolled-Up report, we will trace the counts in the highlighted “Number of Patients with Diagnosis” field back to their source.
Note: Hover over the image for a closer look.
You can:
- Run either the of the followings report types:
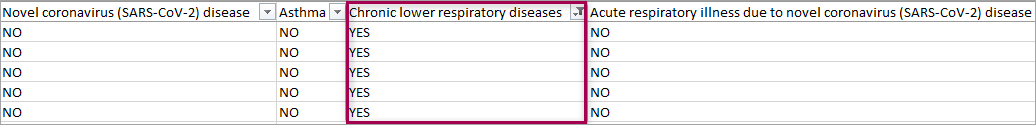
- Filtered Data — Filter the Filtered Data report in Excel to match the Rolled Up report type using the “Chronic lower respiratory disease” column and remember to manually deduplicate the PATIENTID column to match the number of patients in the Rolled Up report. Note that columns have been removed from the screenshot below to fit into this document.
Filtered by Patient — Filter the Filtered by Patient report in Excel to match the Rolled Up report type using the "Chronic lower respiratory disease" column by excluding blank values. Counting the Enterprise ID column will provide the count of patients, and summing the "Chronic lower respiratory disease" column will provide the test volume.
Note: Hover over the image for a closer look.
-
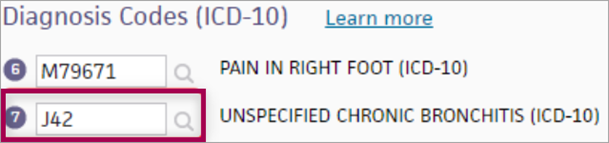
Use the CLAIM_ID field from the Filtered Data report to find the claim related to one of the patients in athenaOne. Scroll down to the “Diagnosis Codes (ICD-10)” section of the claim page to see relevant diagnosis codes (J42, in this example).
-
Use the PATIENTID field to navigate to a patient chart and review the relevant encounter summary (however we recommend the claim page for tracing this data because it is typically the easiest option).
You know your data best, so here are some questions to ask about your data to help you be confident about its accuracy.
-
"Does the number of patients and visits seem reasonable for each diagnosis and service category?"
-
"Are there any Service/Test Categories that you would expect to be populated but are not, or are overpopulated?"
-
"Can I trace the visits from a single field from the Rolled Up data report back through the Filtered Data report and use the CLAIM_ID to find and confirm the data for those diagnoses/procedures?"
-
Make sure the date range selected for the report includes the dates of service you are looking for.
-
Confirm that the department(s) from which you expect to see UDS data has a row in the Department Government Designation table. Make sure that each valid department has a designation starting with "FQHC". If any changes need to be made to this table, reach out to your Customer Success Manager (CSM).
-
Identify a claim or encounter example that you would have expected to be in the table. Check the CPT code(s) on the claim/encounter and make sure that the code on the claim/encounter is a valid CPT code. You can double-check by running the UDS Visit Inclusion report to see why a claim might not have been included.
- UDS Reports (user guide)
- Run UDS Reports
- QA UDS Table 3A
- QA UDS Table 3B
- QA UDS Table Patients by Zip
- QA UDS Table 9D
- QA UDS Table 6A
- QA UDS Table 5
- QA UDS Table 5 – Selected Services Detail Addendum
- QA UDS Table 4
- QA UDS Tables 7B and 7C
- QA UDS Table 7A
- QA UDS Table 6B
- UDS Provider Type Mapping
- UDS Reporting Overview — CPT Inclusions and Exclusions