QA UDS Table 7A
athenaCollector + athenaClinicals
This is a topic that focuses on Uniform Data System (UDS) reporting. Use this topic to learn more about how to QA Table 7A.
- UDS Reports (user guide)
- Run UDS Reports
- QA UDS Table 3A
- QA UDS Table 3B
- QA UDS Table Patients by Zip
- QA UDS Table 9D
- QA UDS Table 6A
- QA UDS Table 5
- QA UDS Table 5 – Selected Services Detail Addendum
- QA UDS Table 4
- QA UDS Tables 7B and 7C
- QA UDS Table 7A
- QA UDS Table 6B
- UDS Provider Type Mapping
- UDS Reporting Overview — CPT Inclusions and Exclusions
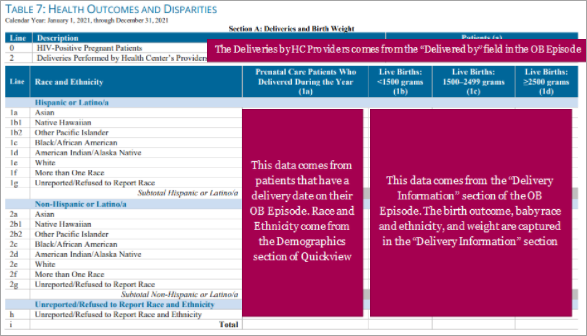
Section A of Table 7 reports details on birth weight by Race and Ethnicity for patients with a qualifying UDS visit during the reporting year.
From the menu bar: Reports > Report Library > UDS Tab > UDS Table 7 – Section A
This table buckets prenatal patients by race and ethnicity, and by birth weight.
This section describes relevant logic that is used to identify or categorize data for this table.
Line 0: HIV-Positive Pregnant Patients
-
athenaOne does not report on this line because many organizations track this information outside of athenaOne. There is no way to reliably capture this information in athenaOne.
Line 2: Deliveries Performed by Health Center’s Providers
-
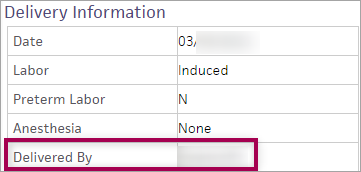
A delivery is reported on Line 2 if the name of a provider at the Health Center is selected from the “Delivered By” drop down of the OB Episode. Providers at your Health Center are defined by providers that have been included in your provider table (Settings > Admin > Billing > Providers).
-
For details on the “Delivered By” field and what's changed from 2020 see the release note from an April 2021 update.
Prenatal Care Patients Who Delivered During the Year (1a)
-
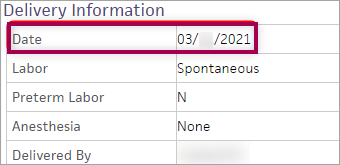
athenaOne assumes that a prenatal care patient delivered if the “Delivery Date” field of the OB Episode is entered, and the patient’s vital signs are linked to the OB Episode. Each OB Episode is linked to a Clinical Episode. If the Clinical Episode has vital signs recorded, then that patient is considered part of the prenatal care program.
Live Births (1b, 1c, 1d)
-
There is no significant logic applied to these columns. Birth weights are bucketed per HRSA specifications.
This section describes the data sources for this table and where you can view that data within athenaOne.
Deliveries Performed by Health Center’s Providers
-
This data comes from the Delivered By field in the “Delivery Information” section of the OB Episode.
Race and Ethnicity for the Prenatal Care Patient
-
This data comes from the Race and Ethnicity fields in the “Demographics” section of the patient Quickview.
Race and Ethnicity for the Baby
-
This data comes from the Race and Ethnicity fields in the “Delivery Information” section of the OB Episode.
Live Birth Weight
-
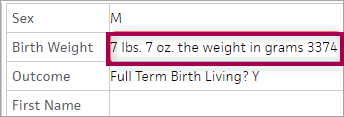
This data comes from the Birth Weight and Outcome fields in the “Delivery Information” section of the OB Episode.
This section provides examples of how to trace pieces of data from the Rolled Up report back to athenaOne.
athenaOne action:
-
Beginning with the Rolled Up report, we will trace the count of patients in the highlighted fields from the “Prenatal Care Patients Who Delivered During the Year” column and the “Live Births =>2500 grams” column back to their source in athenaOne.

Tip: Hover over the image for a closer look.
You can:
-
Filter the Filtered Data report in excel to match the Rolled Up report using the PATIENT_UDSRACENAME column. Note that columns have been removed from the screenshot below to fit into this document.

Tip: Hover over the image for a closer look. -
Use the PATIENT_ID field from the Filtered Data report to find an example patient in athenaOne. In the patient chart, use the Find Tab to search for “ob episode” and select the relevant episode to see a delivery date during the reporting year and birth weight.


athenaOne action:
- Beginning with the Rolled Up report, we will trace the count of deliveries in from the highlighted “Deliveries Performed by Grantee’s Providers” field back to their source in athenaOne.

You can:
- Filter the Filtered Data report in excel to match the Rolled Up report using the PATIENT_DELIVERYBYCATEGORY column filtered to the value “GRANTEE”. Note that columns have been removed from the screenshot below to fit into this document.

Tip: Hover over the image for a closer look. - Use the PATIENT_ID field from the Filtered Data report to find an example patient in athenaOne. In the patient chart, use the Find Tab to search for “ob episode” and select the relevant episode to see the “Delivered By” provider.

| Report type | What it does | When to use it |
| Rolled Up Data | Presents data in the format for UDS Reporting | Use this report type to preview or pull your report for submission |
| Filtered Data | Presents the complete data used to produce the Rolled Up view | Use this report type if you prefer to roll up your own data or if you are conducting QA on the data contained within the Rolled Up view |
| Raw Data | Presents all data from FQHC departments, including non-UDS visits | Use this report type if you are conducting QA to determine discrepancies in your Rolled Up or Filtered reports |
You know your data best, so here are some questions to ask about your data to help you be confident about its accuracy.
-
"Does the number of deliveries performed by providers at your health center seem reasonable based on your patient population and the services your health center provides?"
-
"Does the number of prenatal care patients at your health center seem reasonable based on your patient population and the services your health center provides?"
-
"Can I trace a prenatal patient from a single field from the Rolled Up data report back through the Filtered Data report and use the PATIENTID to find and confirm the delivery and race/ethnicity of the patient?"