QA UDS Table 6B
athenaCollector + athenaClinicals
This is a topic that focuses on Uniform Data System (UDS) reporting. Use this topic to learn more about how to QA Table 6B.
- UDS Reports (user guide)
- Run UDS Reports
- QA UDS Table 3A
- QA UDS Table 3B
- QA UDS Table Patients by Zip
- QA UDS Table 9D
- QA UDS Table 6A
- QA UDS Table 5
- QA UDS Table 5 – Selected Services Detail Addendum
- QA UDS Table 4
- QA UDS Tables 7B and 7C
- QA UDS Table 7A
- QA UDS Table 6B
- UDS Provider Type Mapping
- UDS Reporting Overview — CPT Inclusions and Exclusions
This table reports performance on a set of clinical quality measures designed to measures care processes that are correlated with positive long-term health outcomes for patients. The table contains two sections related to prenatal care patients with a quality measure defined by HRSA, and the remaining sections report data based almost exclusively on eCQMs as defined by CMS.
From the menu bar: Reports > Report Library > UDS Tab > UDS Table 6B
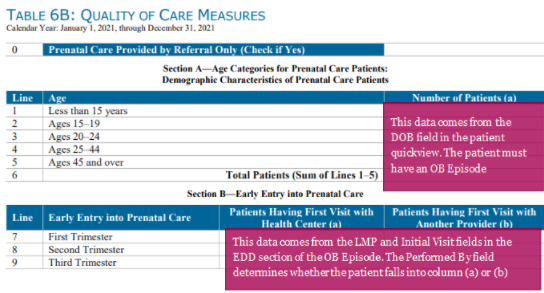
This table has 13 sections (A – M) that bucket different types of quality information. The information in the document below divides these sections into two broad groups. First, sections A and B are addressed together because they are specific to prenatal care patients. Second, sections C through M are addressed together because they report data from eCQMs defined by CMS and leveraged by HRSA (with the exception of the HIV Linkage to Care measure, which does not have a related eCQM).
This section describes relevant logic that is used to identify or categorize data for this table.
Age
-
The prenatal patient’s age is calculated as of December 31st of the reporting year to align with UDS specifications.
Number of Patients (a)
-
The prenatal patient is counted if they have a UDS Visit and an active OB Episode during the reporting year.
-
An OB Episode is active if patient vitals are reported. If no vitals are reported in the OB Episode, or if the delivery date is before the patient’s initial visit date, the patient is not included in the report.
Early Entry into Prenatal Care
The trimester of entry into prenatal care is calculated using the patient's Last Menstrual Period (LMP) or, when available, based on the Estimated Date of Delivery (EDD). If both LMP and EDD are present, the EDD value should be used to determine the trimester.
Trimester classifications are defined as:
-
First Trimester: The patient's first prenatal visit occurred at an estimated gestational age of 0 through 13 weeks. Gestational age is calculated from either:
-
The number of weeks since the first day of the LMP, or
-
The gestational age derived from EDD, calculated as 40 weeks minus the number of weeks remaining until the EDD at the date of the initial visit.
-
-
Second Trimester: The first visit occurred at an estimated gestational age between 14 and 27 weeks based on LMP or EDD as described above.
-
Third Trimester: The first visit occurred at an estimated gestational age of 28 weeks or greater.
Example of EDD-based gestational age calculation
If the initial visit is on July 8, 2025, and the patient's EDD is October 15, 2025 (approximately 14 weeks ahead), then:
-
Gestational age = 40 weeks - 14 weeks = 26 weeks
-
Therefore, the patient's trimester at the visit is the second trimester.
The patient counts in Table 6B Section B (lines 7–9) should be calculated according to this guidance.
Patients Having First Visit with Health Center (a) / Patients Having First Visit with Another Provider (b)
-
The “Performed by” field in the EDD Calculation section of the OB Episode is used to determine whether the initial visit is with a provider in your health center.
-
The “Performed by” field is a dropdown list of the providers in your health center that dynamically populates the provider’s name. Please select from the dropdown list in order to correctly capture when an initial visit takes place with a provider in your health center. The "Performance by" field can also accept free text if the initial visit takes place with a provider outside of your health center. Any data not selected by the dropdown will count towards column B of section B.
-
Note: In the Rolled Up version of the Table 6B report there is an “Initial Provider Not Recorded” field to highlight OB Episodes where there is no provider documented in the “Performed by” field. In the Filtered Data report, see the PRENATAL_INITIALBY column for the patients with blank fields.
Column (a) and column (b)
-
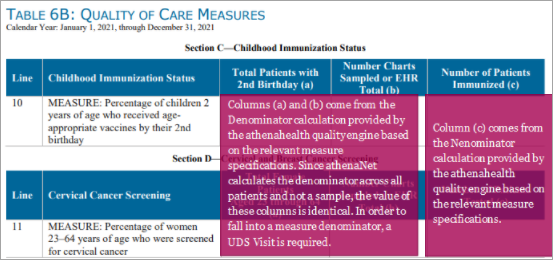
In these sections, these two columns are populated by the denominator value calculated by athenahealth’s quality engine for the relevant quality measure(s).
-
To be included in the denominator a patient must have at least one UDS Visit during the reporting period. For additional information about UDS Visits, see the How UDS Reporting Identifies a UDS Visit topic.
Column (c)
-
In these sections, these two columns are populated by the numerator value calculated by athenahealth’s quality engine for the relevant quality measure.
Reviewing the logic of every measure in Sections C – M is outside the scope of this document. The exact triggers for a patient to be included in the denominator and numerator of every quality measure in Sections C - M are best viewed in the individual Measure Satisfaction Guides on Success Community.
This section describes the data sources for this table and where you can view that data within athenaOne.
Age
-
This data comes from the “DOB” field in the “Identification/Provider” section of the patient Quickview.
Trimester of entry into prenatal care
-
This data comes from the “Last menstrual period” field and “Initial exame date” field in the “EDD Calculation” section of the OB Episode.
Patient’s first visit with Health Center (or with another provider)
-
This data comes from the “Performed by” field in the “EDD Calculation” section of the OB Episode.

Denominator and Numerator Inclusion
-
The exact triggers for a patient to be included in the denominator and numerator of the relevant measures in these sections are included in the Measure Satisfaction Guides on Success Community.
Note: Sections A and B of Table 6B have been removed in the image below.

This section provides examples of how to trace pieces of data from the Rolled Up report back to athenaOne.
athenaOne action:
-
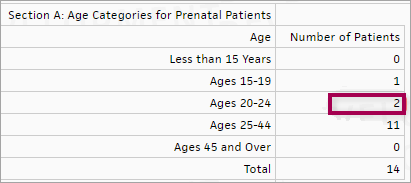
Beginning with the Rolled-Up report for Table 6 we will trace the counts in the highlighted “Ages 20-24” field.

You can:
-
Filter the Filtered Data report in excel to match the Rolled Up report using the PATIENT_PRENATALCARE and PATIENT_AGE columns. Note columns have been removed from the screenshot below to fit in this document.
Note: The PATIENT_AGE column in the Filtered Data report calculates age based on the current date rather than the patient's age on June 30th of the performance year. As such, if there are any discrepancies between the Rolled Up count and the Filtered Data count, you can calculate patient age on June 30th manually using the PATIENT_DOB column.
-
Use the ENTERPRISE_ID field from the filtered data to search for the patient in athenaOne and navigate to the patient chart. Use the Search tab and search for “ob episode”. Click into the relevant OB Episode summary to confirm the patient is in prenatal care and to confirm the patient age, which is located in the OB Episode summary.

athenaOne action:
-
Beginning with the Rolled-Up report for Table 6 we will trace the counts in the highlighted “Second Trimester” field.

You can:
-
Filter the Filtered Data report in excel to match the Rolled Up report using the PATIENT_PRENATALCARE and PRENATAL_TRIMESTER columns. Note columns have been removed from the image below to fit in this document.

-
Use the ENTERPRISE_ID field from the filtered data to search for the patient in athenaOne and navigate to the patient chart. Use the Search tab and search for “ob episode”. Click into the relevant OB Episode summary. Note the empty highlighted section below, which is consistent with this patient being present in the “Initial Provider Not Recorded” column above.

athenaOne action:
-
Below is an example from one of the quality measures in sections C - M (Section J: Colorectal Cancer Screening). Beginning with the Rolled-Up report for Table 6 we will trace the counts in the highlighted “Number of Patients with Appropriate Screening for Colorectal Cancer” field. Put another way, this is the numerator count for the Colorectal Cancer Screening measure.

Tip: Hover over the image for a closer look.
You can:
-
Filter the Filtered Data report using the COLORECTALCANCERSCREENING field. Filter to “SATISFIED” if looking for patients in the numerator, as in this example. Use the “SATISFIED”, “NOTSATISFIED”, and “NEEDSWORK” statuses to capture patients in the denominator of the measure.
Note: In cases where a patient has multiple births in a single year, that patient will be duplicated in the Filtered Data report rows such that you may have to account for these patients while trying to match the data to the rolled up reports. You can use whatever method is most convenient, but if you are seeing Filtered Data totals consistently slightly larger than the Rolled Up totals, remove any duplicate prenatal patients from your Filtered Data counts.
-
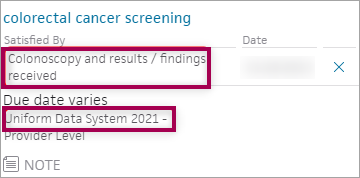
Use the ENTERPRISE_ID field to search for the patient in athenaOne and navigate to the patient chart. Open the Quality Tab in the patient chart. In this example, the patient satisfies the measure. In this scenario, navigate to “OTHER MEASURES” in the Quality Tab.

-
In the “OTHER MEASURES” section, click the relevant measure to see information about how the patient satisfied the measure. The flyout button highlighted below will give you more detailed information about how the measure was satisfied.

Note: The example above came from the Colorectal Cancer Screening measure. However, the exact same procedure can be used for the Diabetes Poor Control measure.
| Report type | What it does | When to use it |
| Rolled Up Data | Presents data in the format for UDS Reporting | Use this report type to preview or pull your report for submission |
| Filtered Data | Presents the complete data used to produce the Rolled Up view | Use this report type if you prefer to roll up your own data or if you are conducting QA on the data contained within the Rolled Up view |
| Raw Data | Presents all data from FQHC departments, including non-UDS visits | Use this report type if you are conducting QA to determine discrepancies in your Rolled Up or Filtered reports |
You know your data best, so here are some questions to ask about your data to help you be confident about its accuracy.
-
"Can I trace patients from the Filtered Data report back to athenaOne to confirm the presence or absence of the relevant clinical values that would satisfy, or not satisfy, the quality measure?"
-
"Are there any examples of patients that we believe should be satisfied in a quality measure, but the Filtered Data report indicates they are not satisfied?"
-
Make sure the date range selected for the report includes the dates of service you are looking for.
-
Confirm that the department(s) from which you expect to see UDS data has a row in the Department Government Designation table. Make sure that each valid department has a designation starting with "FQHC". If any changes need to be made to this table, reach out to your Customer Success Manager (CSM).
-
Identify a claim or encounter example that you would have expected to be in the table. Check the CPT code(s) on the claim/encounter and make sure that the code on the claim/encounter is a valid CPT code. You can double-check by running the UDS Visit Inclusion report to see why a claim might not have been included.