QA UDS Tables 7B and 7C
athenaCollector + athenaClinicals
This is a topic that focuses on Uniform Data System (UDS) reporting. Use this topic to learn more about how to QA Tables 7B and 7C.
- UDS Reports (user guide)
- Run UDS Reports
- QA UDS Table 3A
- QA UDS Table 3B
- QA UDS Table Patients by Zip
- QA UDS Table 9D
- QA UDS Table 6A
- QA UDS Table 5
- QA UDS Table 5 – Selected Services Detail Addendum
- QA UDS Table 4
- QA UDS Tables 7B and 7C
- QA UDS Table 7A
- QA UDS Table 6B
- UDS Provider Type Mapping
- UDS Reporting Overview — CPT Inclusions and Exclusions
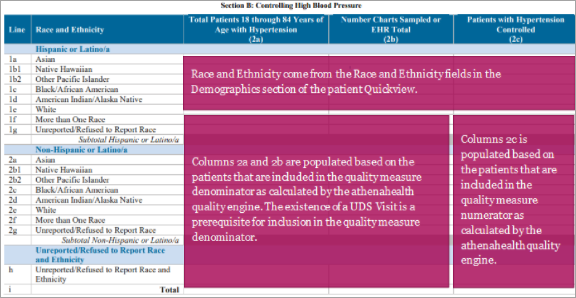
Section B of Table 7 reports details on patients’ status in the Controlling High Blood Pressure (CMS165v9) clinical quality measure broken down by race and ethnicity.
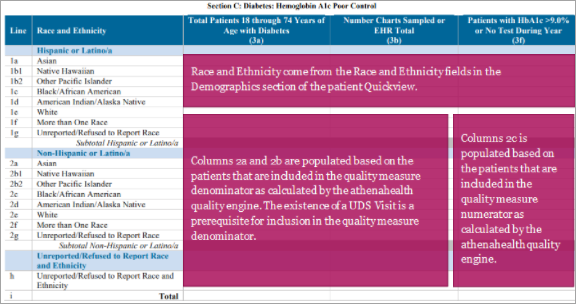
Section C of Table 7 reports details on patients’ status in the Diabetes: Hemoglobin A1c (HBA1c) Poor Control (>9.0 percent) (CMS122v9) clinical quality measure broken down by race and ethnicity.
-
From the menu bar: Reports > Report Library > UDS Tab > UDS Table 7 – Section B
-
From the menu bar: Reports > Report Library > UDS Tab > UDS Table 7 – Section C
This table buckets patients by race and ethnicity, and by status in the Controlling High Blood Pressure measure (section B) or Diabetes: Hemoglobin A1c Poor Control measure (section C).
This section describes relevant logic that is used to identify or categorize data for this table.
Total Patients 18 through 84 Years of Age with Hypertension (2a)
Number Charts Sampled or EHR Total (2b)
-
These two columns are populated by the denominator value calculated by athenahealth’s quality engine for the Controlling High Blood Pressure measure.
-
To be included in the denominator a patient must have at least one UDS Visit during the reporting period. For additional information about UDS Visits, see the How UDS Reporting Identifies a UDS Visit document.
Patients with Hypertension Controlled
-
This column is populated by the numerator value calculated by athenahealth’s quality engine for the Controlling High Blood Pressure measure.
The exact triggers for a patient to be included in the denominator and numerator of the Controlling High Blood Pressure measure are included in the Measure Satisfaction Guide.
Race and Ethnicity
-
All ethnicity selections except for “Not Hispanic or Latino” and “Patient Declined” are categorized as Hispanic/Latino.
-
If multiple races are selected for a patient, then the patient appears on Line 1f/2f, “More than one race”, and not on any other line.
-
If “Other Race” is selected for a patient, then the patient appears on Line 1g/2g, “Unreported/Refused to report race”.
Total Patients 18 through 74 Years of Age with Diabetes (3a)
Number Charts Sampled or EHR Total (3b)
-
These two columns are populated by the denominator value calculated by athenahealth’s quality engine for the Diabetes: Hemoglobin A1c Poor Control measure.
-
To be included in the denominator a patient must have at least one UDS Visit during the reporting period. For additional information about UDS Visits, see the How UDS Reporting Identifies a UDS Visit document.
Patients with Hypertension Controlled
-
This column is populated by the numerator value calculated by athenahealth’s quality engine for the Diabetes: Hemoglobin A1c Poor Control measure.
The exact triggers for a patient to be included in the denominator and numerator of the Diabetes: Hemoglobin A1c Poor Control measure are included in the Measure Satisfaction Guide.
Race and Ethnicity
-
All ethnicity selections except for “Not Hispanic or Latino” and “Patient Declined” are categorized as Hispanic/Latino.
-
If multiple races are selected for a patient, then the patient appears on Line 1f/2f, “More than one race”, and not on any other line.
-
If “Other Race” is selected for a patient, then the patient appears on Line 1g/2g, “Unreported/Refused to report race”.
This section describes the data sources for this table and where you can view that data within athenaOne.


This data comes from the Race and Ethnicity fields in the “Demographics” section of the patient Quickview.
The exact triggers for a patient to be included in the denominator and numerator of the Controlling High Blood Pressure measure and the Diabetes: Hemoglobin A1c Poor Control measure are included in the Measure Satisfaction Guides on the Success Community.
This section provides examples of how to trace pieces of data from the Rolled Up report back to athenaOne.
athenaOne action:
-
Beginning with the Rolled-Up report for Table 7 Section A, we will trace the counts in the highlighted “Patients with Hypertension Controlled” field. Note that rows have been removed from the Rolled Up report in the screenshot below to fit into this document.

Tip: Hover over the image for a closer look.
You can:
-
Filter the Filtered Data report in excel to match the Rolled Up report using the PATIENT_UDSETHNICITYNAME, PATIENT_UDSRACENAME, and HYPERTENSION_STATUS columns. In the HYPERTENSION_STATUS column, use the “SATISFIED” status to capture patients that are in the measure numerator (satisfy the measure). Use the “SATISFIED”, “NOTSATISFIED”, and “NEEDSWORK” statuses to capture patients in the denominator of the measure.

Tip: Hover over the image for a closer look.
-
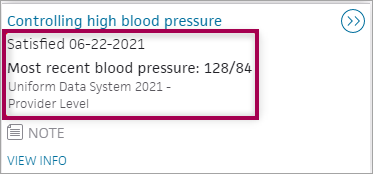
Use the ENTERPRISE_ID field to search for the patient in athenaOne and navigate to the patient chart. Open the Quality Tab in the patient chart. In this example, the patient satisfies the measure. In this scenario, navigate to “OTHER MEASURES” in the Quality Tab.

-
In the “OTHER MEASURES” section, click the relevant measure to see information about how the patient satisfied the measure. The flyout button highlighted below will give you more detailed information about how the measure was satisfied.

-
If you are looking for a patient that has not satisfied the measure, use the steps above, but do not look in the “OTHER MEASURES” section of the Quality Tab. Instead, use the “NEEDS ATTENTION” section.
-
The example above came from the Controlling High Blood Pressure measure. However, the exact same procedure can be used for the Diabetes Poor Control measure.
Tip: To confirm the race and ethnicity data, navigate from the patient chart to the patient Quickview. Scroll down to the “Demographics” section and see the Race and Ethnicity fields.
| Report type | What it does | When to use it |
| Rolled Up Data | Presents data in the format for UDS Reporting | Use this report type to preview or pull your report for submission |
| Filtered Data | Presents the complete data used to produce the Rolled Up view | Use this report type if you prefer to roll up your own data or if you are conducting QA on the data contained within the Rolled Up view |
| Raw Data | Presents all data from FQHC departments, including non-UDS visits | Use this report type if you are conducting QA to determine discrepancies in your Rolled Up or Filtered reports |
You know your data best, so here are some questions to ask about your data to help you be confident about its accuracy.
-
"Can I trace patients from the Filtered Data report back to athenaOne to confirm the presence or absence of the relevant clinical values that would satisfy, or not satisfy, the quality measure?"
-
"Are there any examples of patients that we believe should be satisfied in a quality measure, but the Filtered Data report indicates they are not satisfied?"
-
Make sure the date range selected for the report includes the dates of service you are looking for.
-
Confirm that the department(s) from which you expect to see UDS data has a row in the Department Government Designation table. Make sure that each valid department has a designation starting with "FQHC". If any changes need to be made to this table, reach out to your Customer Success Manager (CSM).
-
Identify a claim or encounter example that you would have expected to be in the table. Check the CPT code(s) on the claim/encounter and make sure that the code on the claim/encounter is a valid CPT code. You can double-check by running the UDS Visit Inclusion report to see why a claim might not have been included.